IntentVsOutcome
Intent vs. Outcome: adding another layer to expected possession value
This is a thinking out loud kind of post. A bunch of basic charts and numbers are here which should be enough to give an idea of what I’m proposing. I want to think about this some more, which is usually a long and slow process because life gets in the way, before doing a version with nice looking vizes, etc. + also get feedback and comments from you guys.
Introduction
http://www.lukebornn.com/papers/fernandez_sloan_2019.pdf proposes a probabilistic possession value based on combining the possession value ( PV ) of the part of the pitch from a PV model, the probability of the ball being controlled in the part of the pitch from a pitch control model, the pass difficulty from a pass probability model, and the probability of the ball being played to that part of the pitch from an action likelihood model. These numbers can then be used to infer passing tendencies, awareness, positioning, and many other things.
Pitch control, pass probability, and action likelihood are outcome based models. Pitch control tells you the probability of controlling the ball if it were played to that part of the pitch. Pass probability tells you the probability of successfully making a pass to a particular point on the pitch and is likely based on historic pass data which means it is outcome based. Action likelihood is also probably based on historic match data and is also probably outcome based. An additional aspect we need to evaluate things like player decision making is intent. That’s what the rest of the post is about.
We’ll exclude action likelihood and only look at the output just from the possession value and the pitch control models. This lets us evaluate any opportunity across the pitch without prejudice for what players tend to do in that situation.
If you’re familiar with pitch control and possession value, you can probably just glance at the Glossary section and then skip straight to the Intent vs. Outcome section.
EPV Methodology
Pitch Control
Pitch control tells you the probability of a team and its players controlling the ball at various parts of the pitch if the ball were to be passed there. This is done for each instant of the game and changes based on the positions of the players and their movement.
I use Spearman’s model but you could probably swap it out for any other model too.
Possession Value
The probability of scoring at the end of a play / in the next some moves / in the next some seconds once the team has a ball in a particular part of the pitch.
I’ve used the PV grid at https://raw.githubusercontent.com/Friends-of-Tracking-Data-FoTD/LaurieOnTracking/master/EPV_grid.csv which looks like this for a team attacking left to right -
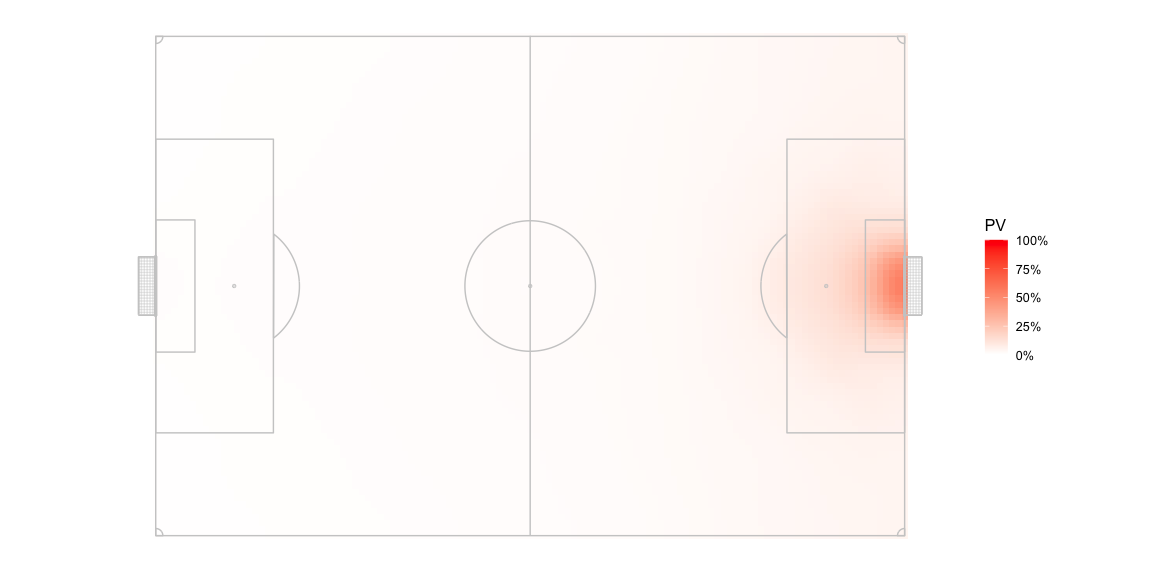
The possession value sharply climbs close to 50% near the opposition goal but is quite low for most of the pitch.
We can rotate the pitch halfway around and get the PV values for the respective part of the pitch for the opposition since that team is attacking right to left.
You should be able to swap it out for another PV model, if you so prefer.
Combining Pitch Control and Possession Value - Glossary
You should be able to combine these to evaluate what passing options offer progress to the team in possession.
- The team in possession already has a certain PV depending on where
they have the ball:
AttackOriginPV - The defending team is equally at risk of conceding a goal from that
position, so
DefenseOriginPV = -AttackOriginPV - Assuming it is possible to pass to every point on the pitch,
(x,y), the PV for each target location can be calculated for both the teams,AttackTargetPV_xyandDefenseTargetPV_xy - At every point on the pitch,
(x,y), the attacking team has a probability of keeping control of the ball,AttackProbabilty_xy, and therefore the defending team’s probability isDefenseProbabilty_xy = 1 - AttackProbabilty_xy - At every point,
(x,y), we can estimate an expected PV for playing a pass there:- For the attacking team,
AttackTargetEPV_xy = ( AttackProbabilty_xy * AttackTargetPV_xy ) - ( DefenseProbabilty_xy * DefenseTargetPV_xy ) - For the defending team, which is the same as the above formula
with the attacking / defending terms exchanged,
DefenseTargetEPV_xy = ( DefenseProbabilty_xy * DefenseTargetPV_xy ) - ( AttackProbabilty_xy * AttackTargetPV_xy )
- For the attacking team,
- The expected change in PV by passing the ball from the current
position to a target position can be calculated as the difference of
the above terms from the PV of the starting position:
- For the attacking team,
AttackEPVAdded_xy = AttackTargetEPV_xy - AttackOriginPV - For the defending team,
DefenseEPVAdded_xy = DefenseTargetEPV_xy - DefenseOriginPV
- For the attacking team,
- At any point, the optimal action for the attacking team to perform
should be to move the ball to a point which offers the highest
AttackTargetEPV_xy. We’ll call the EPV added at that pointAttackMaxEPVAdded. This value may not always be positive.
A positive AttackEPVAdded_xy implies that passing the ball to that
point on the pitch is likely to increase the chance of scoring even
after considering the risk of conceding the ball. A negative value
implies that passing the ball to that point is likely going to decrease
the chance of scoring.
I ignore the possibility of passes that travel more than 2/3 the length of the pitch. Only Ederson can make such passes. We consider the area that is within a radius of 2/3 length of the pitch at any point of time and ignore everything outside of it.
We can expect DefenseEPVAdded_xy to be positive very often, since
DefenseOriginPV is a negative value so the more interesting thing to
analyse would be AttackEPVAdded_xy.
Combining Pitch Control and Possession Value - Example
I use one frame to give an example of these calculations.
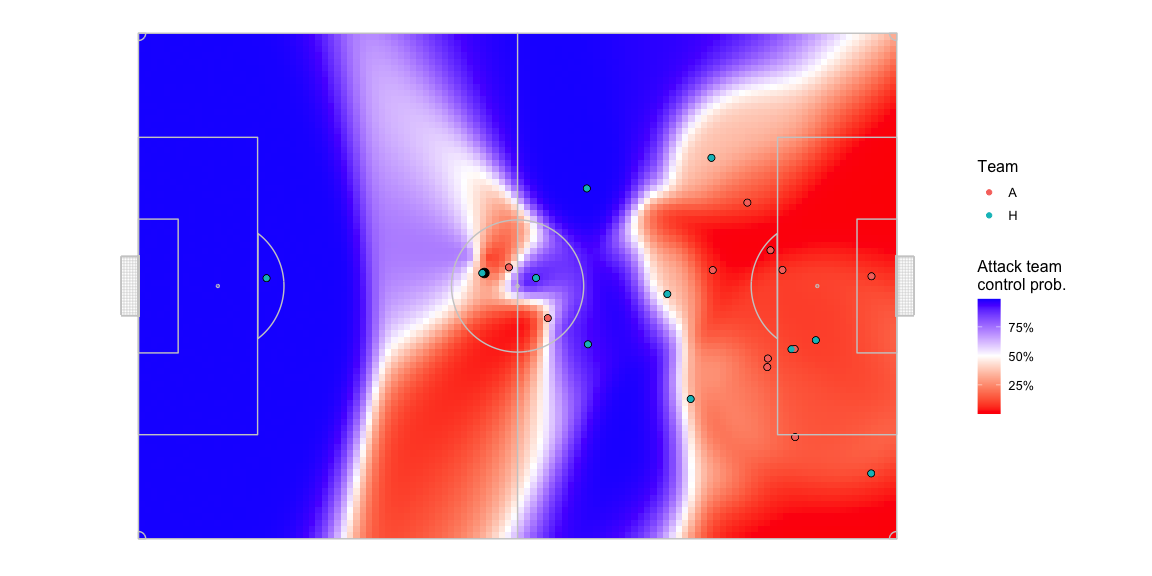
Here is what the pitch control looks like in a random frame. I exclude players that are offside so the two players from the blue team in the offside position have zero contribution to pitch control.
This is what the pitch looks like in terms of AttackEPVAdded_xy.
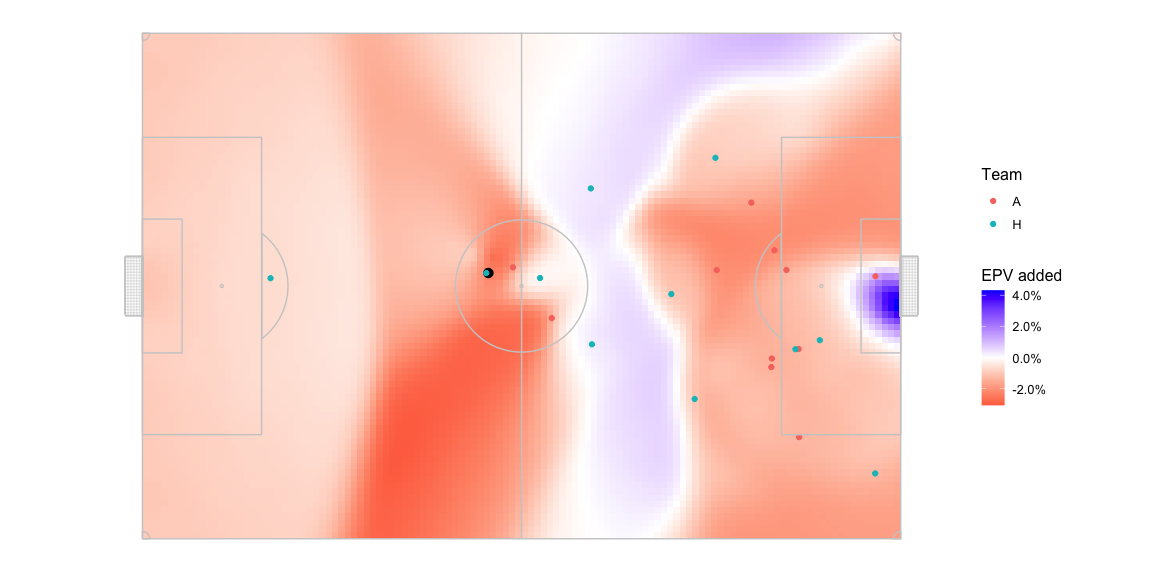
There is some territory in the middle of the pitch where passing the
ball is expected to return a positive AttackEPVAdded_xy. And then
there is an area near the opposition goal, which has a larger
AttackEPVAdded_xy than the middle of the pitch. This area lights up
because 1, the goalkeeper isn’t given extra powers to control the ball
in the pitch control model which is not the case in real life since
keepers can catch the ball with their hands, dive on it, etc. and 2,
pitch control is only reflective of passes, not shots. As a result of
this inconsistency, the logic above would suggest that in this situation
the optimal action for the team in possession, the blue team, should be
to pass the ball all the way to the goal and hope that the small chance
of another player from the same team controlling the ball pays off for
the high reward you’d get from successfully controlling the ball at that
location.
Don’t want to raise your hopes so specifying that what I’ll be proposing here doesn’t directly address this goalkeeper area problem but does help reduce the problem.
Combining Pitch Control and Possession Value
I use game 1 from Metrica Sports’ release available here - https://github.com/metrica-sports/sample-data/tree/master/data/Sample_Game_1. The findings WRT to the home and away team obviously don’t carry over to all games but the more general inferences probably do.
Let us look at the proportion of the pitch that offers a positive
AttackEPVAdded_xy at each instant the team had possession of the ball.
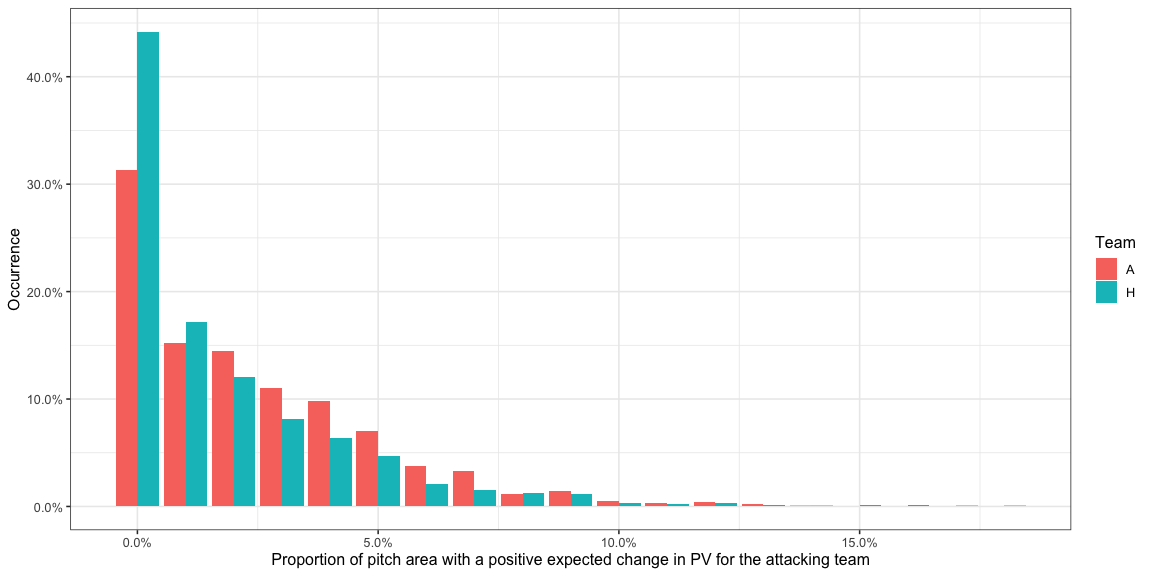
- Most of the time there is a very small part of the pitch, if at all, that offers a positive EPV added for the attacking team. This means there is a very small part of the pitch that the attacking team can pass to and expect their possession value to go up when you factor the risk of conceding the ball.
- 30% to 40% of the time there is less than 1% of the area of the
pitch which offers a positive
AttackEPVAdded_xyfor both the teams. It is exactly 0% of the area in 19% for the home team and 11% for the away team has the ball. A value of 0% forAttackEPVAdded_xymeans the team in possession of the ball has no options on the pitch to pass to where they are expected to increase their chances of scoring by enough to negate the chance of conceding. This is very important because a number of times a pass is played just to retain possession and not necessarily increase the chance of scoring and the typical way PV is applied would give these passes a negative score which is unfair because the situation is not taken into account. - There is almost never a situation where more than 15% of the area of
the pitch offers a positive
AttackEPVAdded_xyfor the attacking team. - The away team usually has options over a bigger area of the pitch than the home team.
Let us look at the values of the AttackEPVAdded_xy itself.
If the team were to randomly pass to any point on the pitch, at each
instant of the game, what AttackEPVAdded_xy could they expect? This
would be the same as averaging the AttackEPVAdded_xy values over the
entire pitch and would look like -
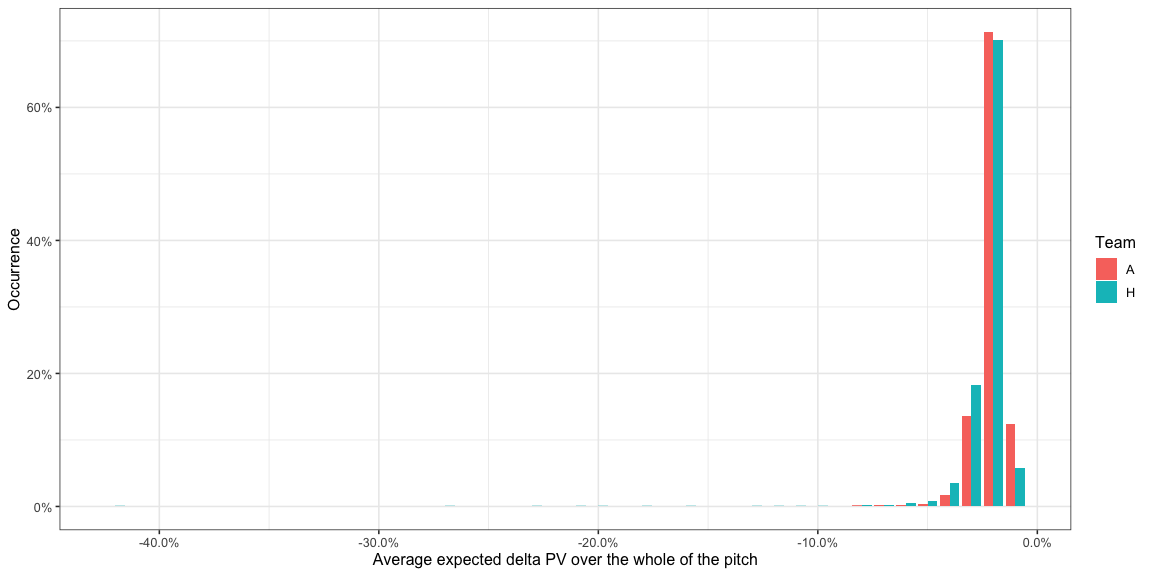
- From the earlier histogram, we saw most of the pitch usually offers a negative EPV added so it isn’t surprising that this distribution is completely in the negative. What this means is that a random pass is more likely to aid the defending team than the attacking team.
If we instead look at the best option the team has at any instant,
AttackMaxEPVAdded -
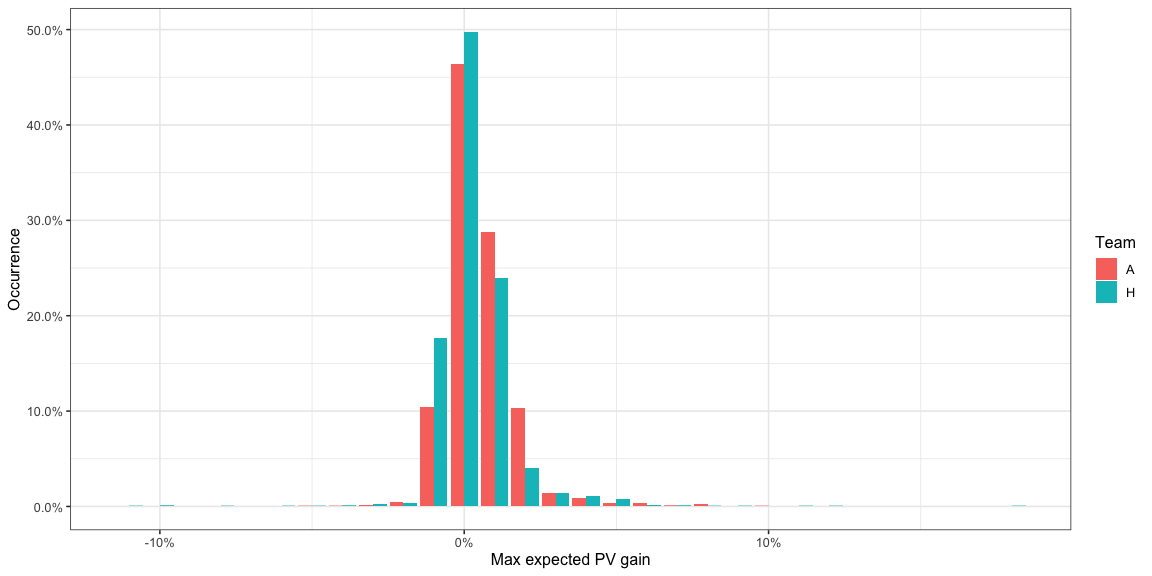
- Most of the time, the best option offers an
AttackMaxEPVAddedbetween -1% and 2% for both teams. Specifically the amount of time is -
| Team | HighAttackMaxDeltaPVIntent\_pct |
|---|---|
| A | 96% |
| H | 95% |
The proportion of time AttackMaxEPVAdded is above 2% -
| Team | LowAttackMaxDeltaPVIntent\_pct |
|---|---|
| A | 3% |
| H | 4% |
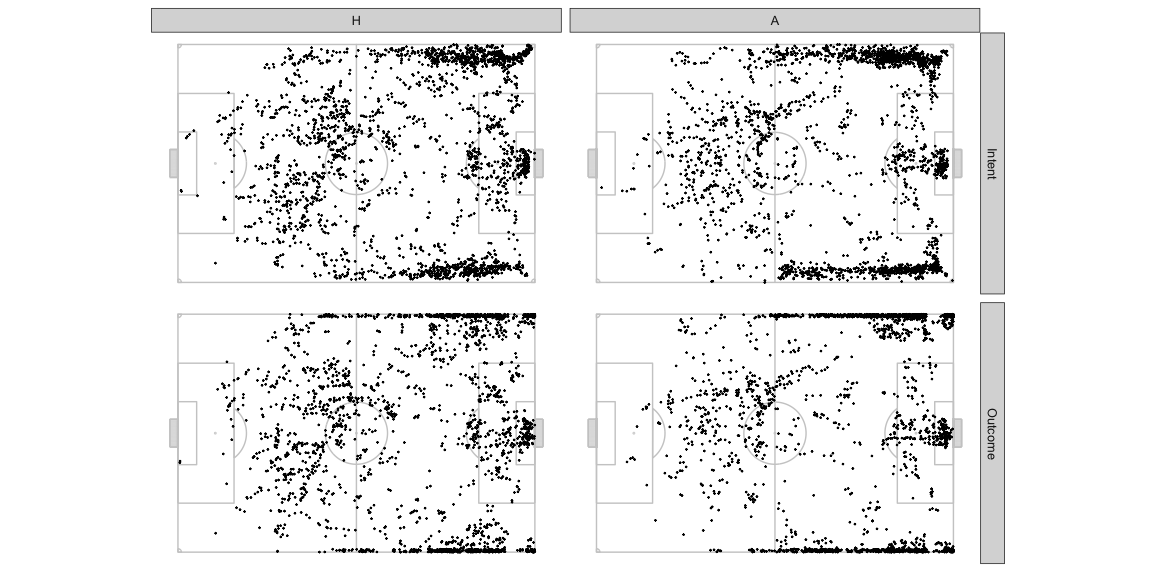
How about where these options are available?
The location offering AttackMaxEPVAdded at each instant during the
sample of frames looks like as below. Both teams have almost equal
possession so don’t worry too much about normalising this chart.
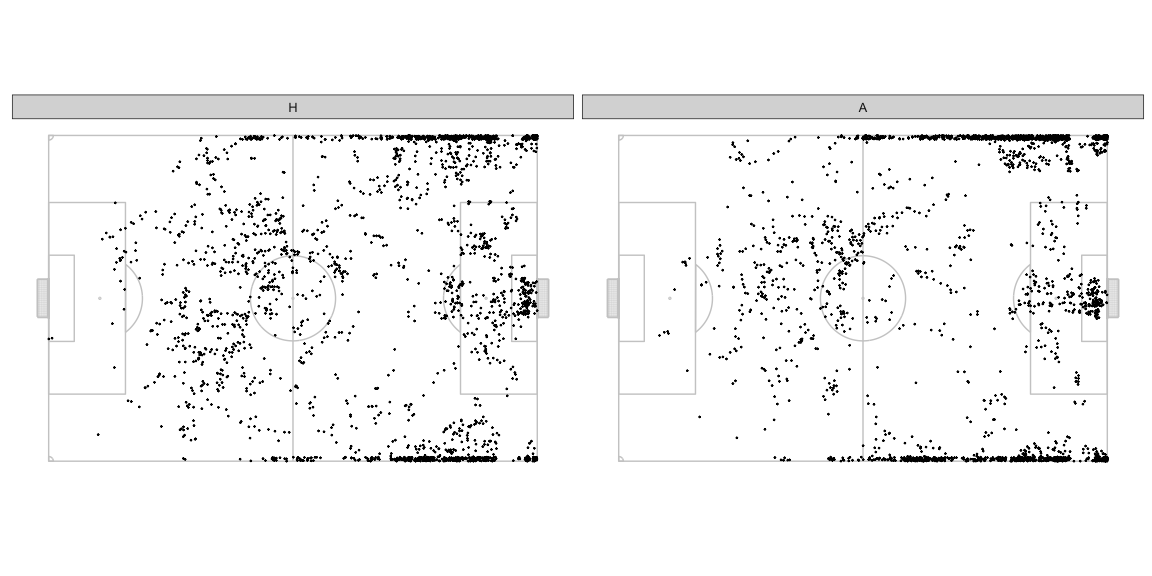
- The home team often has the best opportunity to make progress through the central areas in their own half, the away team uses this area much lesser.
- In the defensive halves, the away team more often presents the best opportunity towards the left side. The home team has better options more often on the right side deeper in their own half, and more often on the left side more advanced in their own half.
- The away team relies on wider areas as the best opportunity to progress much earlier on on the pitch compared to the home team.
- The best options to pass into the box are quite concentrated in front of the goal mouth for the away team. The home team has a few sports around which they offer an option often.
We haven’t looked at the distribution of the ball positions in these frames so we shouldn’t draw detailed conclusions from just these figures. That analysis is not necessary for the point of this post anyway so we’ll skip it. This is just warming you up to how we can look at things.
If we filter only the frames where AttackMaxEPVAdded > 0.02, these
are the frames which had at least one pass which allowed the team to
make substantial progress towards scoring. Note that these are potential
passes that could have been played and not necessarily the actual pass
that was played at the time. There may also have been more than one such
pass at any frame but we will pick only the one with the
AttackMaxEPVAdded value. It’s also likely that during the course of
the play, a similar kind of pass continued to remain the optimal choice
for consecutive frames in the sample and you would therefore see it
multiple times.
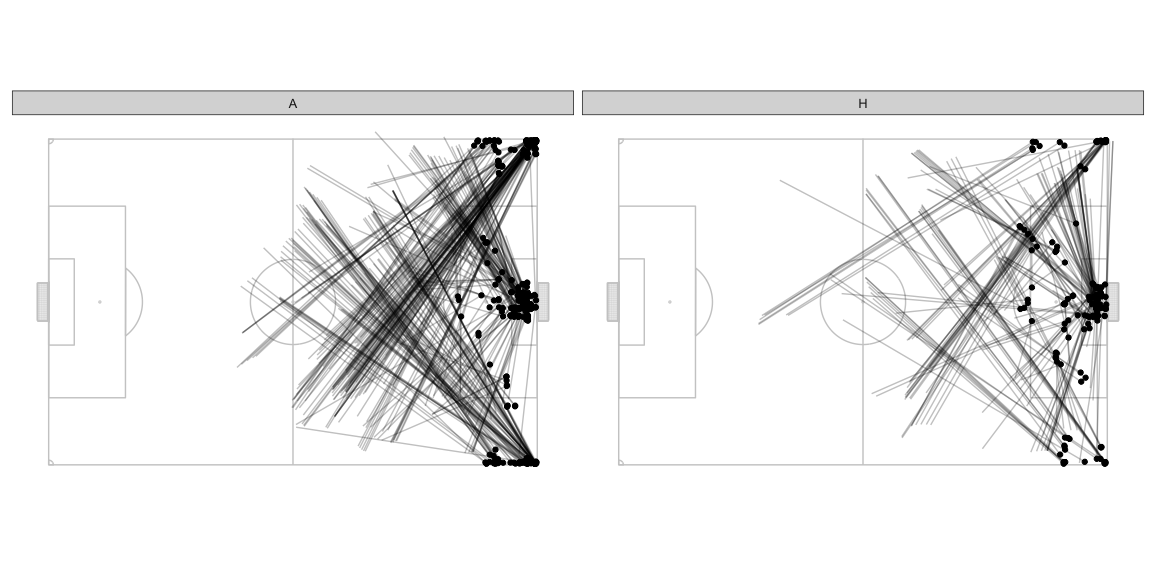
- Lots of diagonal balls from deep in the defensive half to the wings.
- Lots of good opportunities to cross from the deep left for the away team. The home team also has slightly higher opportunities to put the ball in the box being created from the left wing but they have other options as well from other parts of the pitch.
Intent vs. Outcome
This is point of this post. Thanks for staying with me. All the stuff above was to get you comfortable with the setting which hopefully you are by now.
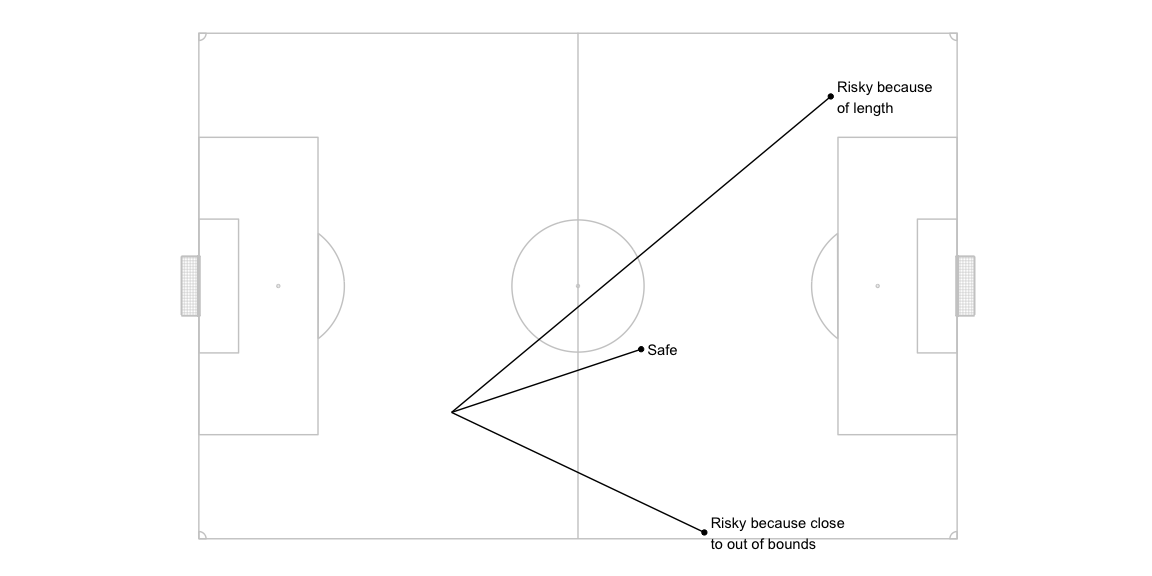
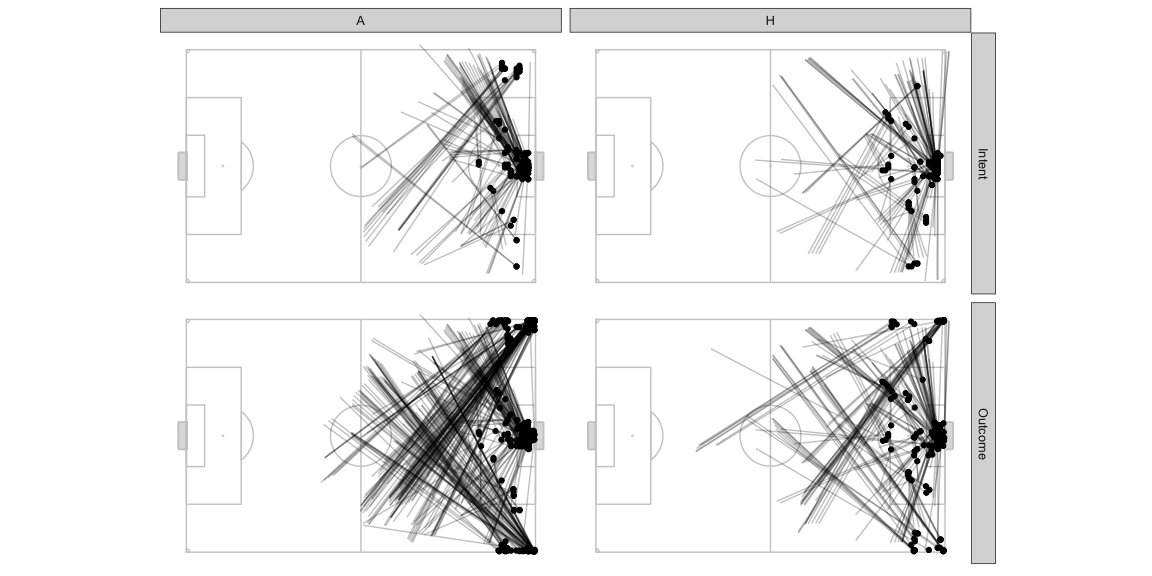
Note how most high value AttackEPVAdded_xy passes are long passes,
often aimed at the edges of the pitch. Note how the optimal targets are
also concentrated around the edges of the pitch. Long passes are likely
to fetch more PV because it usually gets you much closer to the goal
from where the ball was before. Edges of the pitch are more attractive
because defenders will tend to stay towards the insides of the pitch
leaving one side less for a defender to impact the pitch control of a
wide positioned player from the attacking team. This is expected.
The reason I started writing is because while these are rewarding passes if they actually happen, it is also much harder to execute such passes. In the EPV paper, there is a pass probability component which is a logistic regression model but if it is like most other pass probability models then it is also modelling the probability of accurately passing to a particular point on the pitch and the training data is probably based on historic pass data which are again outcomes. I think there is room to improve this.
The risk of passing the ball out of bounds, or not being able to pass
accurately to the point with the maximum EPV added is much higher for
passes close to the sidelines, long passes, and so on compared to easier
passes to someone in the middle of the pitch or to someone closer to the
player in possession. Until now we were looking at an outcome based
AttackMaxEPVAdded i.e. the EPV the team could expect to gain if the
ball reached a particular (x.y) but if we switch to an intention based
AttackEPVAdded_xy, i.e. the EPV the team could expect to gain if the
ball was attempted to be passed to a particular (x.y) then we would
need to incorporate the risks of inaccuracy in passing. There are other
factors that could also cause inaccuracy such as pressure on the ball,
the passer’s body orientation, etc. but for now we will keep it simple
and consider only the length of the pass and the target location. Note
that the term inaccuracy is typically used to describe whether a pass
was successfully received by a teammate but in this post it is being
used to describe whether a pass intended for a particular location
actually reaches that location or goes somewhere else.
To model this inaccuracy - let us assume that a pass intended for a particular location x,y could actually go anywhere in the neighbourhood of x,y depending on how far x,y is from the pass origin location. To simulate this, I take the intended pass target location and calculate possible actual pass target location by adding some noise to the intended coordinates. For actual targets that go out of bounds the appropriate corner, goal kick, or throw in location is calculated and considered as the next event and the PV calculation is done accordingly.
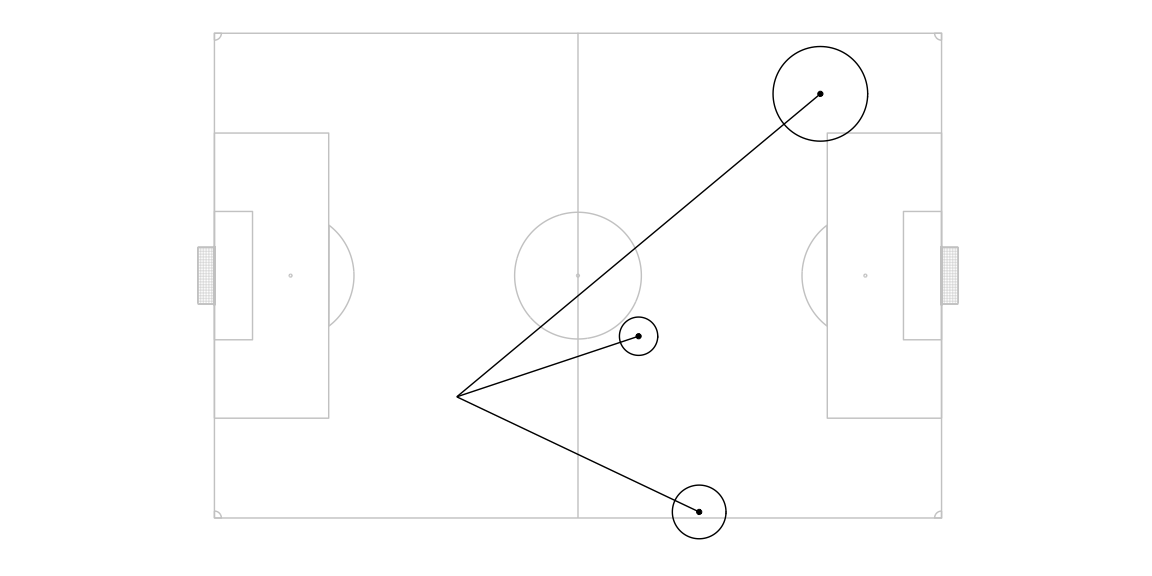
For each intended target location, the probability of the ball landing in any of the actual target location in the neighbourhood of the intended target location is modelled as a two dimensional gaussian centred around the intended target location. The standard deviation of the gaussian is a linear function of the intended pass length such that 99% of the pass attempts land within a radius of ( 10% of the intended pass length ) from the intended pass target location. For computational convenience, we ignore points outside this radius.
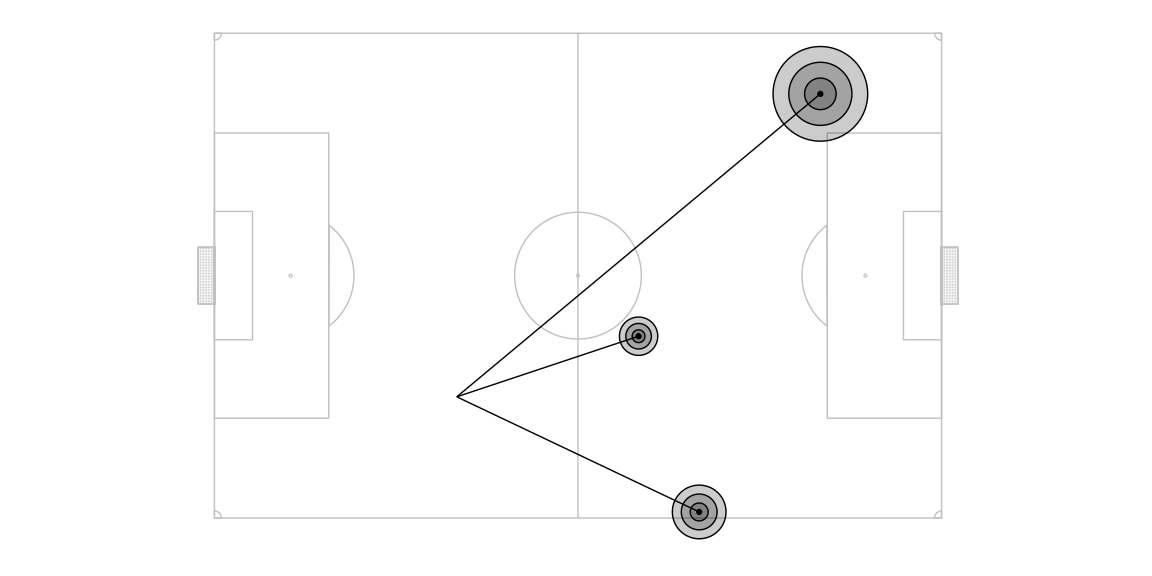
Now that we have these probabilities, we can calculate a new set of pitch control and expected possession values for each intended target location by aggregating the outcome based pitch control and expected possession values of all its actual target locations weighed by the the probability of that actual target location.
This is not the same as just having a pass distance feature in the pass probability logistic regression model. We are redefining pitch control and possession value altogether by differentiating what they mean for a receiver and what they mean for a passer.
Combining Pitch Control, Possession Value, and Intent - Example
Another one frame example to give you an idea of how this manifests. From here on, the charts marked outcome are the same set of numbers from the charts in the earlier section and the charts marked intent are the new set of numbers.
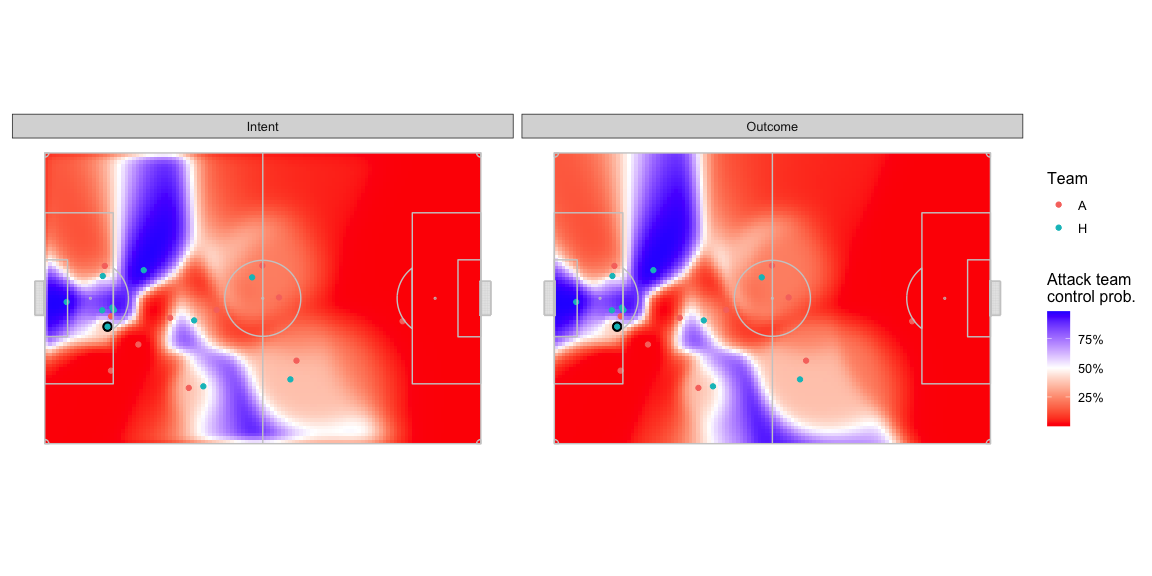
- The intent based versions are a little less crisp in the areas where both teams have similar probabilities of controlling the ball. The parts of the pitch around the edges of the blue team dominated areas are also a little faded out.
Here is what the delta in control probability between the two looks like. Note the change in the colour scale -
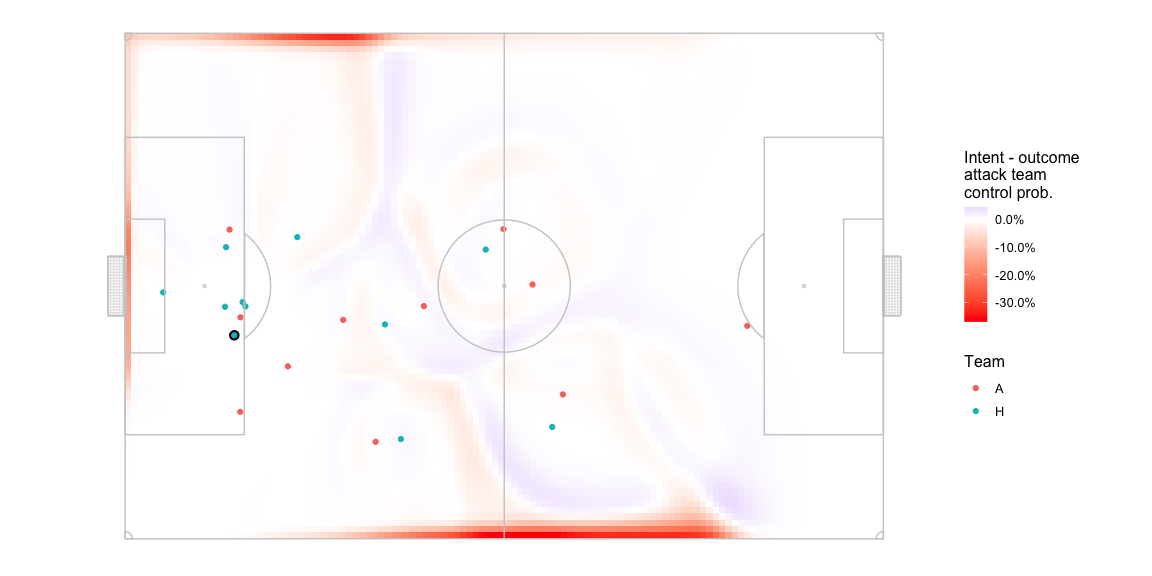
- A drop of up to ~35% in pitch control in some parts close to the edge.
- Lesser magnitude drops in the middle of the pitch.
Let’s exclude the edges and see how much the central areas change by. Again note the change in the colour scale -
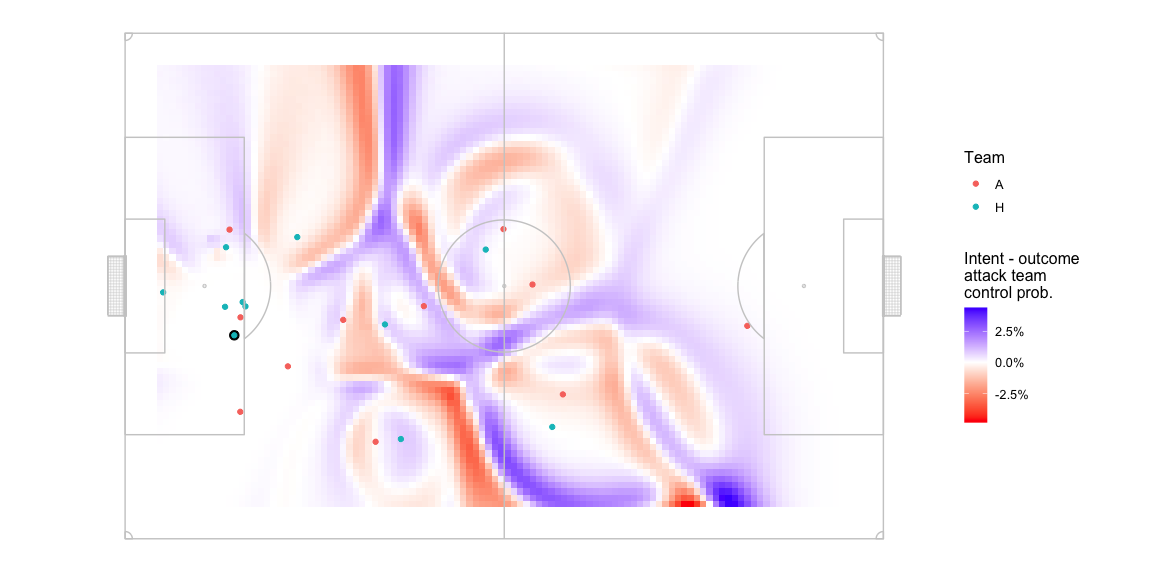
- Drops of +-3% can be seen in the areas away from the areas strongly domainated by either team.
What difference does that translate to in terms of the
AttackEPVAdded_xy
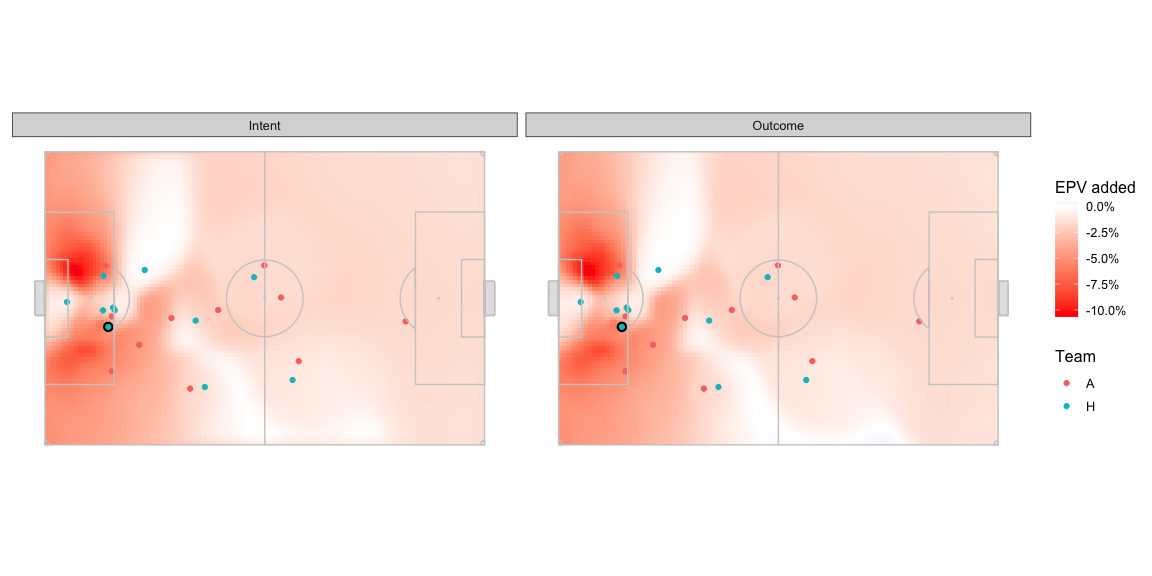
Okay not very easy to spot differences. The delta in the central area looks like -
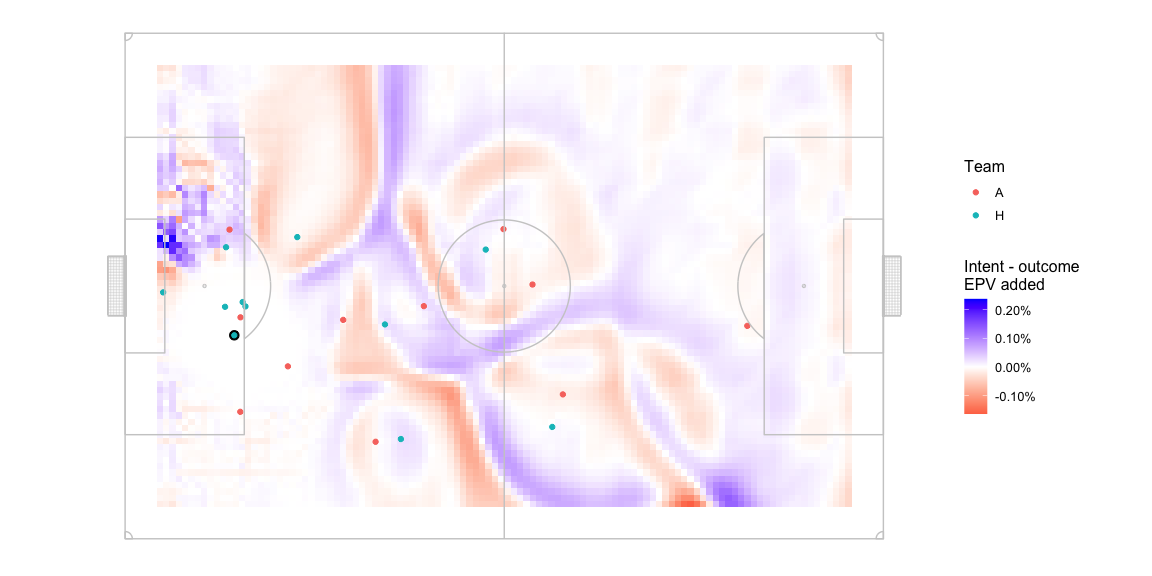
The optimal intent based pass target location is quite far from the optimal outcome based pass target location. Optimal location marked with a + -

The target is still on the right wing, but near the centre line as per the intent model whereas the outcome based optimal location is around a quarter of the length of the pitch farther ahead and much closer to the edge of the pitch.
Combining Pitch Control, Possession Value, and Intent
Before we look at the distributions from earlier again, here is a quick comparison of the change -
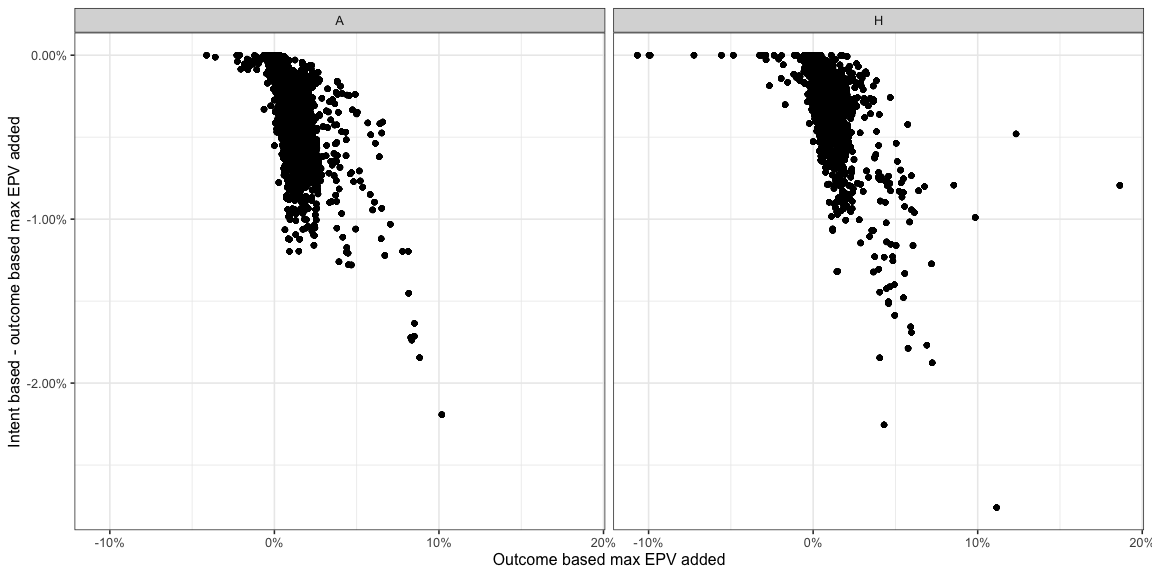
- Most high outcome based
AttackMaxEPVAddedvalues take a hit when you compare them to the corresponding intent basedAttackMaxEPVAdded. This is expected since a lot of these were near the edges of the pitch or very long passes.
Here are the rest of the distributions with the comparisons.
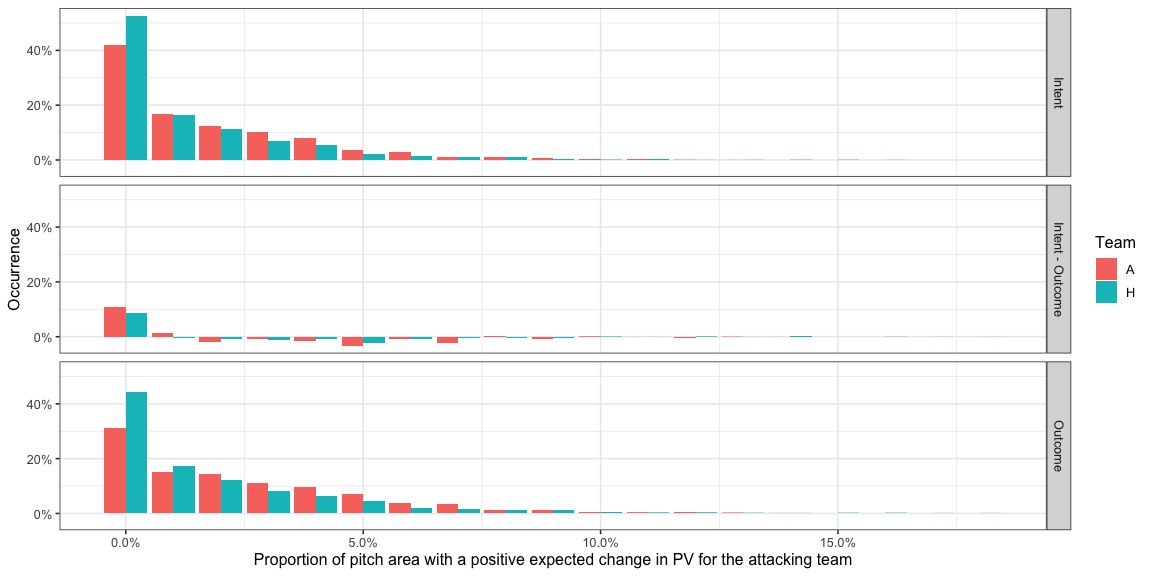
- You can see a shift in the distribution towards the left, from
having larger parts of the pitch having a positive
AttackEPVAdded_xyin the outcome version of the model to smaller parts of the pitch in the intent version of the model.
The other distributions also change in a similar manner -
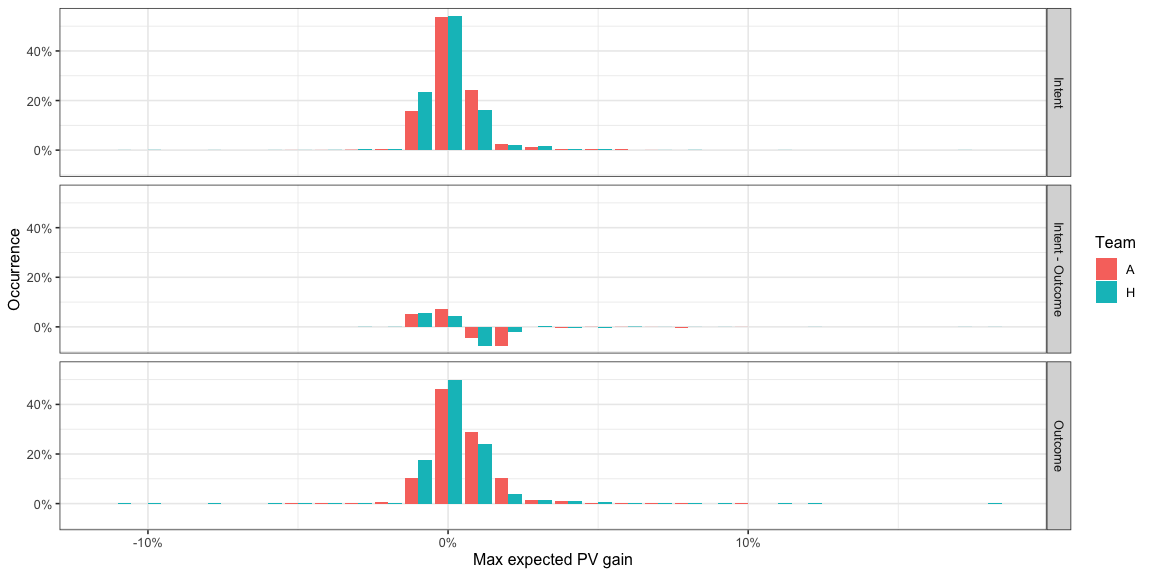
- The distributions move towards lower possible
AttackMaxEPVAddedvalues. This makes sense, you’d expect ådding noise would reduce the reward possible from the optimal choice. - Note how the intent based model suggests fewer passes right at the
goal mouth or at the edge of the pitch on the wings and has much
fewer opportunities for high
AttackMaxEPVAddedpasses. These were the kind of passes where there is a chance of the ball going out of bounds as well or not being hit exactly at the target which get penalised in the intent model but not in the outcome model.
Here is a distribution of the difference in distance between the optimal intent based pass distance and the optimal outcome based pass distance bucketed by the optimal outcome based pass distance.
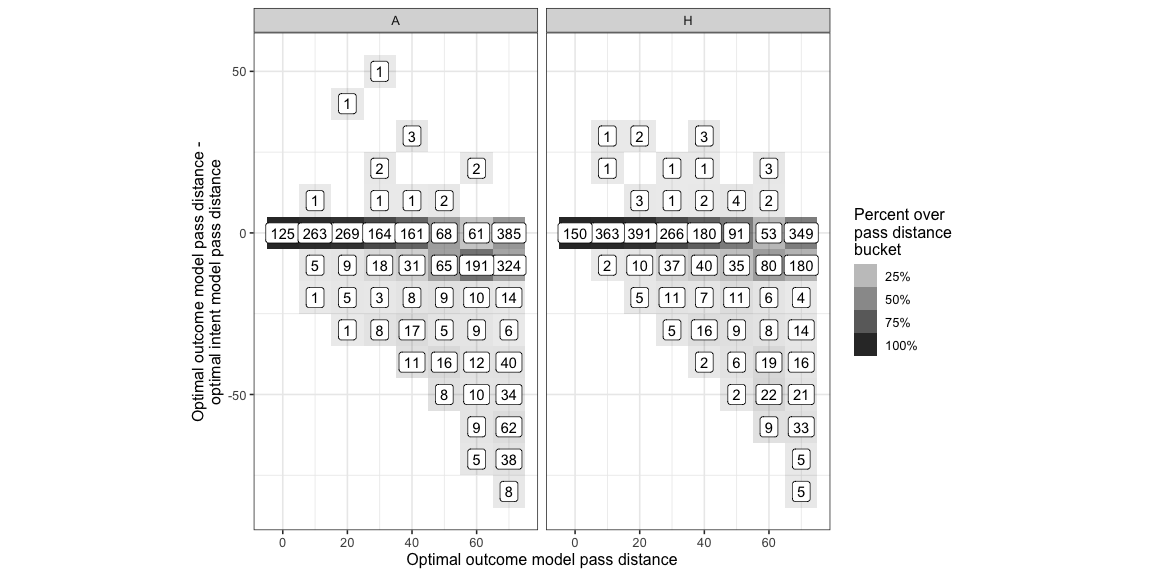
- Long passes are more likely to be in areas with small pockets of space ( no proof for this statement but from watching the game ) so the fact that we include the possibility of slightly wayward passes means the reward of intending to pass to them reduces.
- It’s a little odd that the longest passes aren’t as affected as the medium range passes. A lot of these passes are the ones out to the wing and you can see that in many cases the optimal target just moves inwards a bit which is enough for these targets to still remain pretty far from the ball but not be as risky.
( We use a distance based noise function because we expect longer passes to be harder to execute. The trend of longer passes seeing a more drastic change might be a self-fulfilling result as a consequence of our formulation of noise. Some day we’ll have a good passing inaccuracy model and then we’ll know. )
The distance between the two optimal locations -
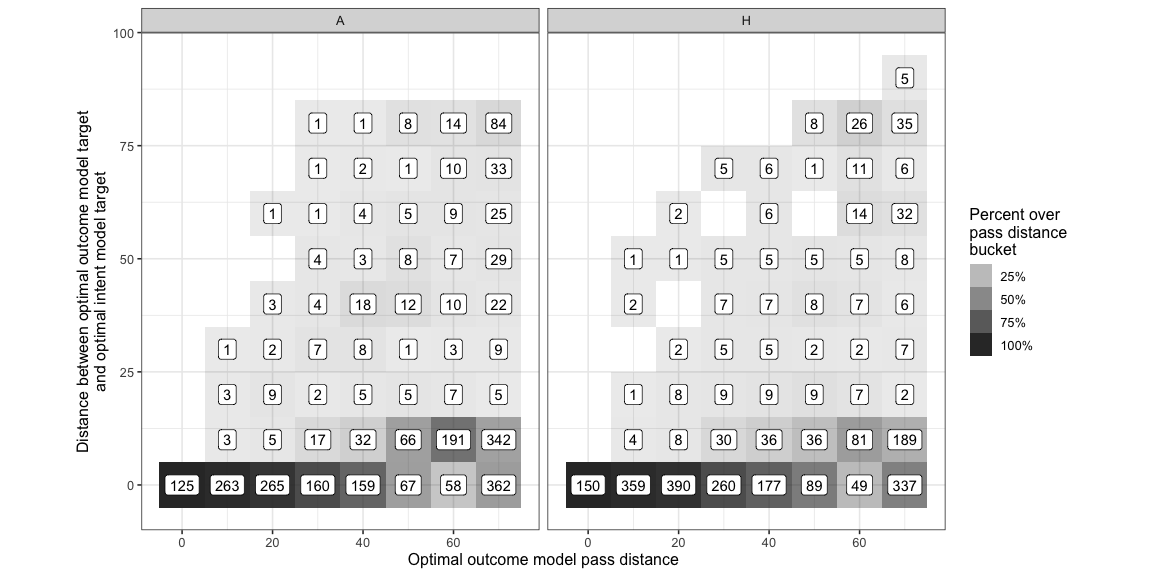
Most of the time is is within 10 units ( 1/12th the length of the pitch ) which means they are close enough to each that is probably doesn’t matter much. There are many cases though where this distance is quite large, i.e. cases the two locations are farther apart than 10 units. Those cases are where an intent based model is evaluating the situation and evaluating the options better than an outcome based model.
| Team | HighDistance |
|---|---|
| H | 15% |
| A | 21% |
Extending this to other actions, eg. shots
If we look at shots as another example, there is a gap between xG and PSxG which is where an intent based model would fit in. xG captures all the possibilities in that situation and PSxG captures the final outcome from that situation but neither are a good measure of intent. To connect intent, wanting to shoot at a particular point on the goal, with a particular speed, with a particular trajectory etc. with outcome, the final shot properties, we could repeat a similar process as above highlighting what sort of errors can be expected in any of those properties of intent. For eg. choosing a very high speed shot probably causes higher noise in the target point on the goal and therefore the intent based PSxG should include other noisy trajectories which consider the possibility of a shot being in the neighbourhood of the final shot to evaluate how good a decision it was to pick that point.
Conclusion
The difference between the expected reward from an intention and an outcome is noteworthy.
There are a lot of simple assumptions built into this analysis. It would be useful to validate those assumptions from data, which I don’t think we can do from publicly available resources though.
Acknowledgements
- Metrica Sports for the public data
- William Spearman for the pitch control model
- Laurie Shaw for code for the pitch control model - https://github.com/Friends-of-Tracking-Data-FoTD/LaurieOnTracking/blob/master/Tutorial3_PitchControl.py and the possession value map - https://github.com/Friends-of-Tracking-Data-FoTD/LaurieOnTracking/blob/master/EPV_grid.csv
- Friends of Tracking for making these resources public
- Javier Fernandez, Luke Bornn, Dan Cervone for the EPV paper - http://www.lukebornn.com/papers/fernandez_sloan_2019.pdf
Get in touch
On Twitter - @thecomeonman, or on mail - mail dot thecomeonman at gmail dot com