PredictingTransferSuccesses
Predicting the Success of a Transfer
Motivation
Predicting transfer successes would make me rich.
Introduction
We’ll try and create a model the predicts the change in a player’s performance after a transfer based on the previous league and the next league. In this process, we will get a more general mapping between pairs of leagues allowing us to extract some more insights.
Inputs
We use VAEP, a way to measure the value of individual actions in football. The link has more details but in short, it calculates a probability of a team eventually scoring a goal as a result of a player performing a certain action.
canzhiye has fortunately computed this for all the players playing in a bunch of leagues for the last some years. TonyElHabr recently used it in a model to solve the same problem as me which is where this discussion started and he was kind enough to help me get access to the data to try my approach on it too. We have different models though so you should go and read his post as well.
Model Structure
This model will centre on a player’s VAEP/minute value as a measure their performance.
Imagine we had just four leagues that we were trying to model. You could go from each league to any other league and that would look a little like this -
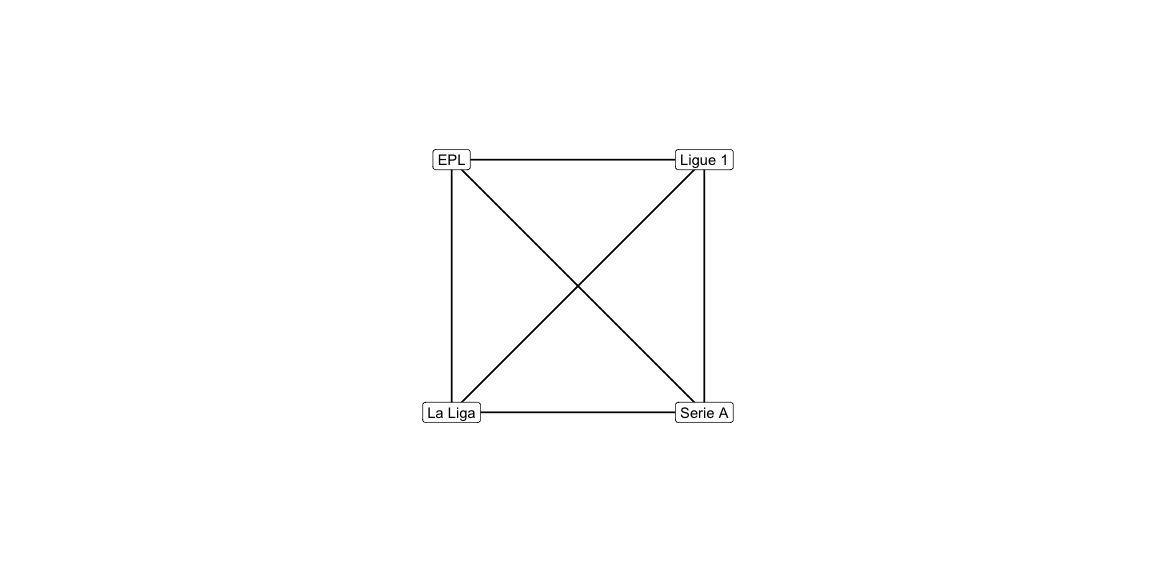
Each link is a path between two leagues and a player could travel in either direction on that link. So a player could go from the EPL to La Liga or from the La Liga to the EPL, and similarly for any other pair of leagues.
Imagine a player moved from the EPL to the La Liga. This player’s VAEP per minute in their last season in the EPL was 0.005 when in the EPL and in their first season in La Liga it was 0.006. This is how this would look like in this visualisation.
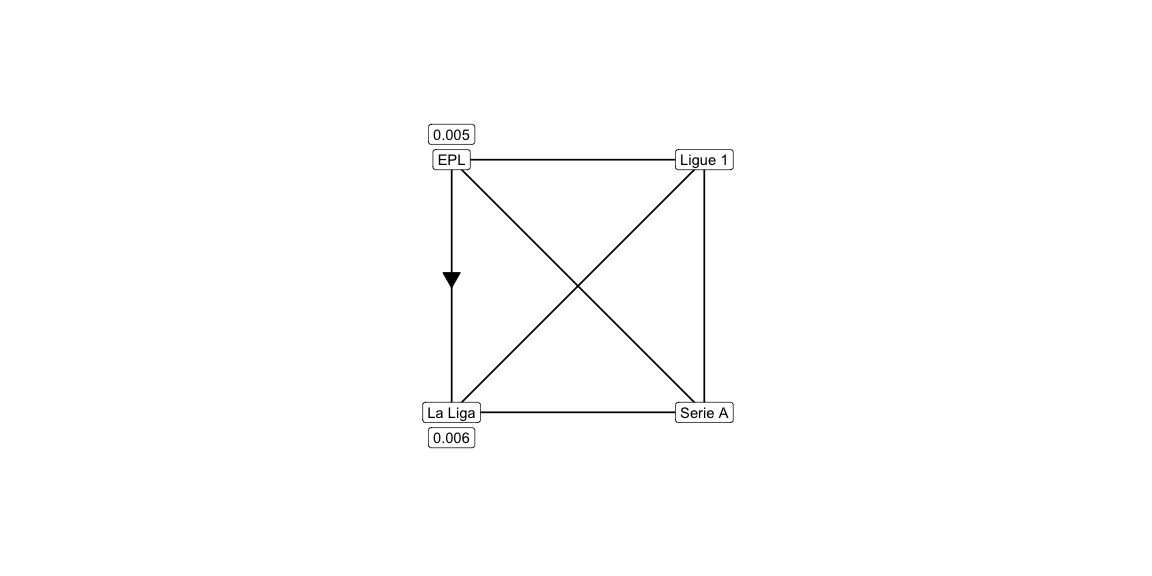
Based on this one observation, we’d say any player going from the EPL to La Liga can expect their VAEP/minute to go to 0.006/0.005 = 120% of what it was in the EPL. Let us ascribe a value of 120% to the EPL - La Liga link. I’m going to call this value the observed VAEP conversion factor.
Let’s do away with links that allow travelling in either direction and keep only links that let you travel in one direction. This means players moving from La Liga to the EPL which would need a different link to the link above. This is what our graph now looks like, with two links connecting each pair of leagues, one of the links from league a to league b, and the other from league b to league a. It’s a little painful to cleanly draw arrows for so many links so going to skip that but hopefully the description makes it clear.
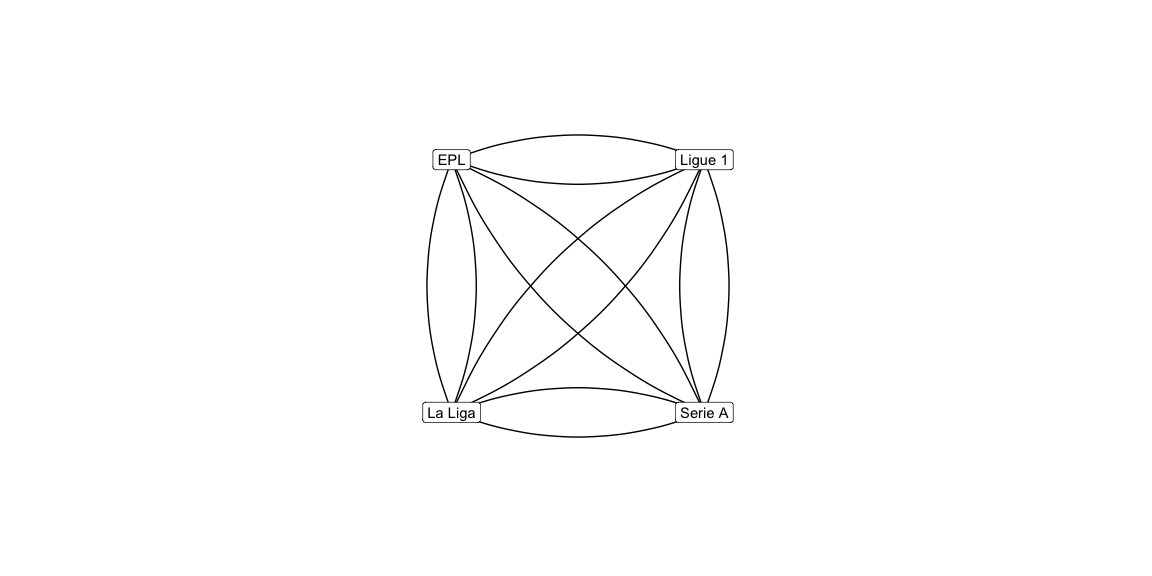
One of the possibilities to model the La Liga to EPL link is to just assume that it is the inverse of the EPL to La Liga. In the earlier example, the EPL to La Liga link was 120% so the La Liga to EPL link would then become 1/120% = 83.33%. I don’t take this approach and I let them remain independent of each other to allow for the possibility that this relationship may not exist between the two links.
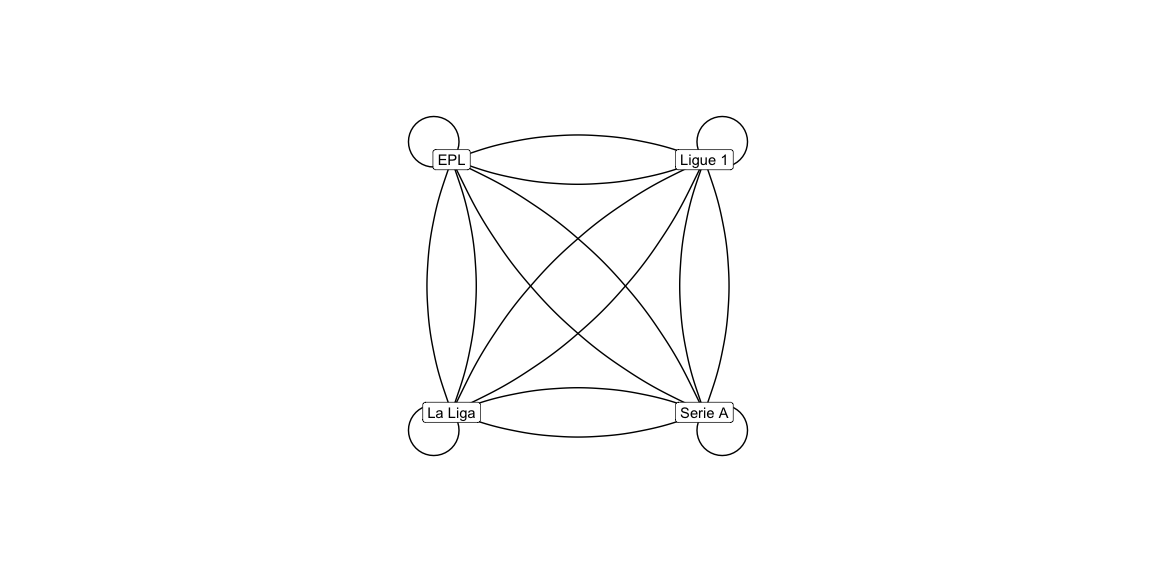
Another kind of transfer possible is also to a different team within the same league. Players could gain or lose on the VAEP / minute metric even for those transfers so we need our model to worry about that too. We would need another kind of link for this which starts and ends at the same league.
Based on actual transfers we can calculate a median observed VAEP conversion factor the links over which players moved. A couple of things to note about this:
-
We can also measure how confident we are about the median based on the number of transfers over that link - the more the transfers the more confident we can be that the median we have calculated is close to the actual VAEP conversion factor of the link. For eg. if we looked at only Eden Hazard moving from EPL to La Liga we’d think the VAEP conversion factor is ( proabably, I’m guessing ) very low from the EPL to La Liga, but if we add Cristiano Ronaldo, Modric, Coutinho, and all the other players that made a move then we would get a better idea of typically what the observed VAEP conversion factor is.
-
We need to incorporate time by giving more importance to recent transfers and less importance to transfers that happened very long ago. Therefore we’d give higher importance to Hazard’s observed VAEP conversion factor, lesser to Ronaldo’s, somewhere in between for Coutinho, and so on.
It is possible that some of these links have seen very few transfers or haven’t seen any transfers recently. We may not have a median observed conversion factor or have one with very low confidence on it. What we can do is use links between other leagues and these two leagues to try and adjust the observed median conversion to get some more confidence. For eg. let us assume we have never seen a transfer between Ligue 1 to the EPL but we have seen transfers from Ligue 1 to La Liga and La Liga to EPL then we can combine the knowledge from the links between these two leagues and La Liga to try and derive or adjust the value for the Ligue 1 to EPL link.
Let us make the assumption that moving from Ligue 1 to the EPL directly would result in a very similar conversion factor as moving from Ligue 1 to La Liga to EPL. In other words, we can estimate the conversion factor of Ligue 1 to EPL as being equal to the conversion factor of Ligue 1 to La Liga * conversion factor of La Liga to EPL. We could also include more roundabout ways of moving from Ligue 1 to EPL, say. Ligue 1 to Serie A to La Liga to EPL, and adjust our Ligue 1 to EPL link’s conversion factor further.
This approach is inherently making an assumption. Imagine we have two Ligue 1 players with a similar VAEP/minute in Ligue 1 who moved to the EPL later in their careers. Let’s say player 1 played in the La Liga between their Ligue 1 and EPL stint while player 2 directly moved from Ligue to the EPL. The calibration process described above kind of ignores the La Liga stint and suggests both players would have a similar VAEP/minute as each other in the EPL as well. This assumption is probably not true but for now we’ll stick with it. More about this later.
Model Evaluation
One way to measure the quality of the calibration is to evaluate the difference in conversion factors on various ways of moving between the same leagues, which I’ll call transfer chains from here on. For eg. how different is the value of the Ligue 1 to EPL conversion factor compared to the Ligue 1 to La Liga conversion factor * La Liga to EPL conversion factor. A well calibrated model should have a very low difference between the two.
Another way to measure the quality of the calibration is to evaluate how far the calibrated conversion factors are from the observed median conversion factors. We’d want the two values to be close to each other, especially for pairs of league where we have seens lots of recent transfers and are confident about our observed median.
Model Calibration
The calibration process iteratively makes adjustments to the conversion factors over links in a manner that the two evaluation criteria improve. It keeps making adjustments until the value of the objectives don’t change by much since at that point the adjustments are probably of too little magnitude to be of consequence.
Results
I had to exclude China Super League from the list of leagues because it shows up in fourth position on here behind Serie A and messes a little with the other leagues as well. I imagine moving to China is very different from moving to a European or South American club and there might be other things beyond just the sporting ability playing a part there.
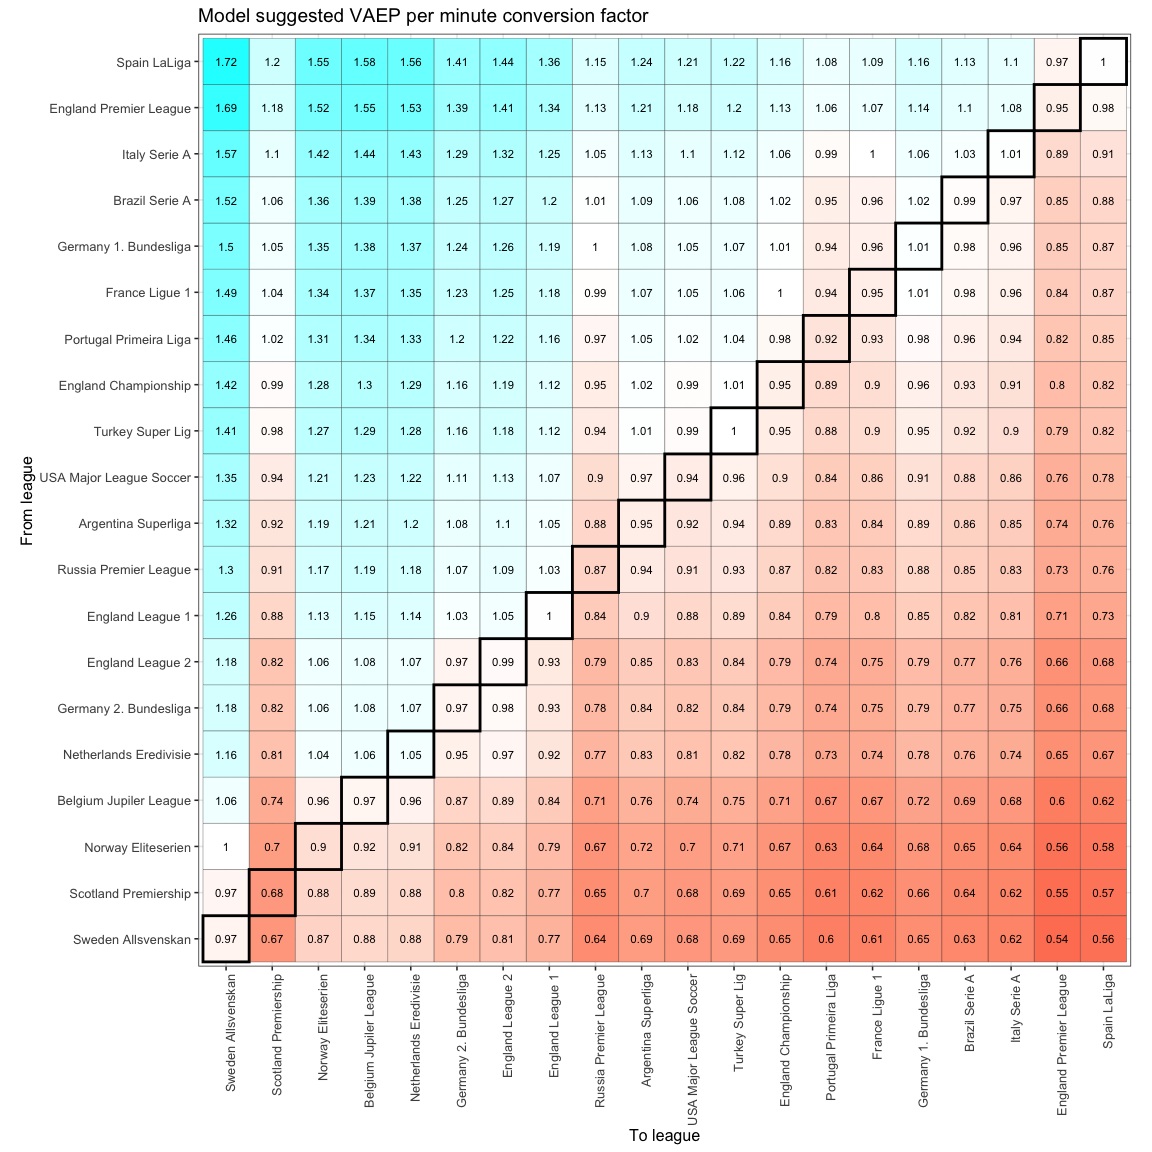
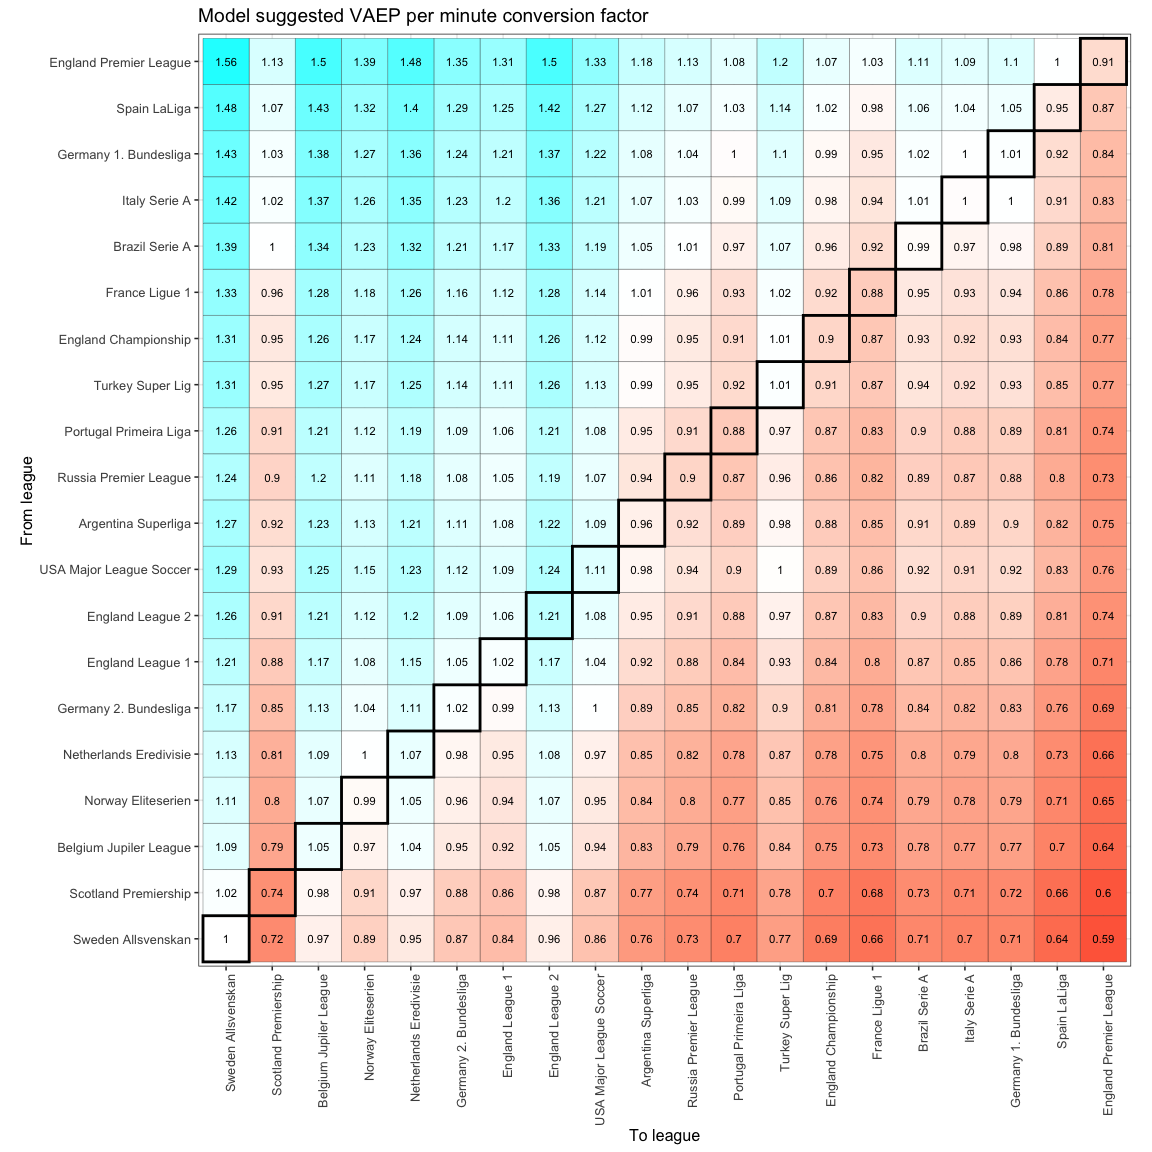
This is what the model suggests are the conversion factors between pairs of leagues.
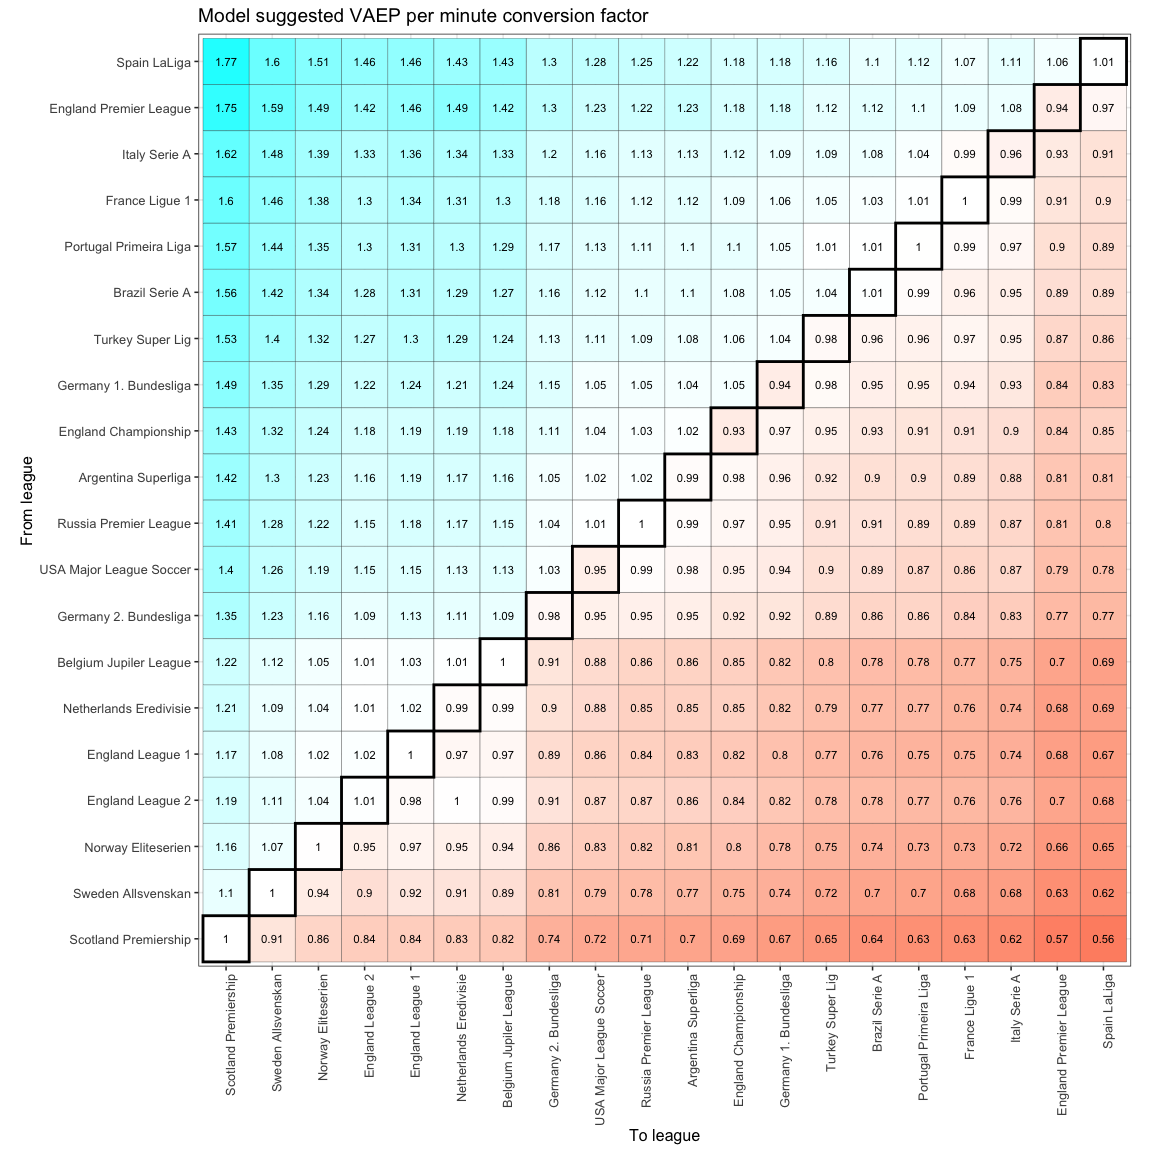
Numbers > 1 indicates moving from the league on the left to the league on bottom usually see the player increase their VAEP/minute by that factor. The order of the leagues is based on how many leagues have a conversion factor of > 1 and is roughly an indication of league strength although strictly speaking it isn’t that. The order is mostly sensible with a few debatable ones though like Portugal’s Primeira Liga being above Germany’s Bundesliga.
It’s interesting that for some of the leagues, a transfer within the same league typically see a drop in the VAEP/minute metric and the conversion factor is almost never > 1 across any of the leagues.
If the earlier discussion about having the two links between a pair of leagues modelled as inverse of each other were true then we’d see diagonally opposite elements being reciprocals of each other, for eg. a transfer from Spain La Liga to the Scotland Premiership typically results in the VAEP/minute becoming 1.77 times or 177% and a transfer in the other direction see it become 0.55 times which is approximately = 1/1.77 so the inverse relationship holds.
Here is a comparison of every conversion factor with the inverse of it’s corresponding opposite link -
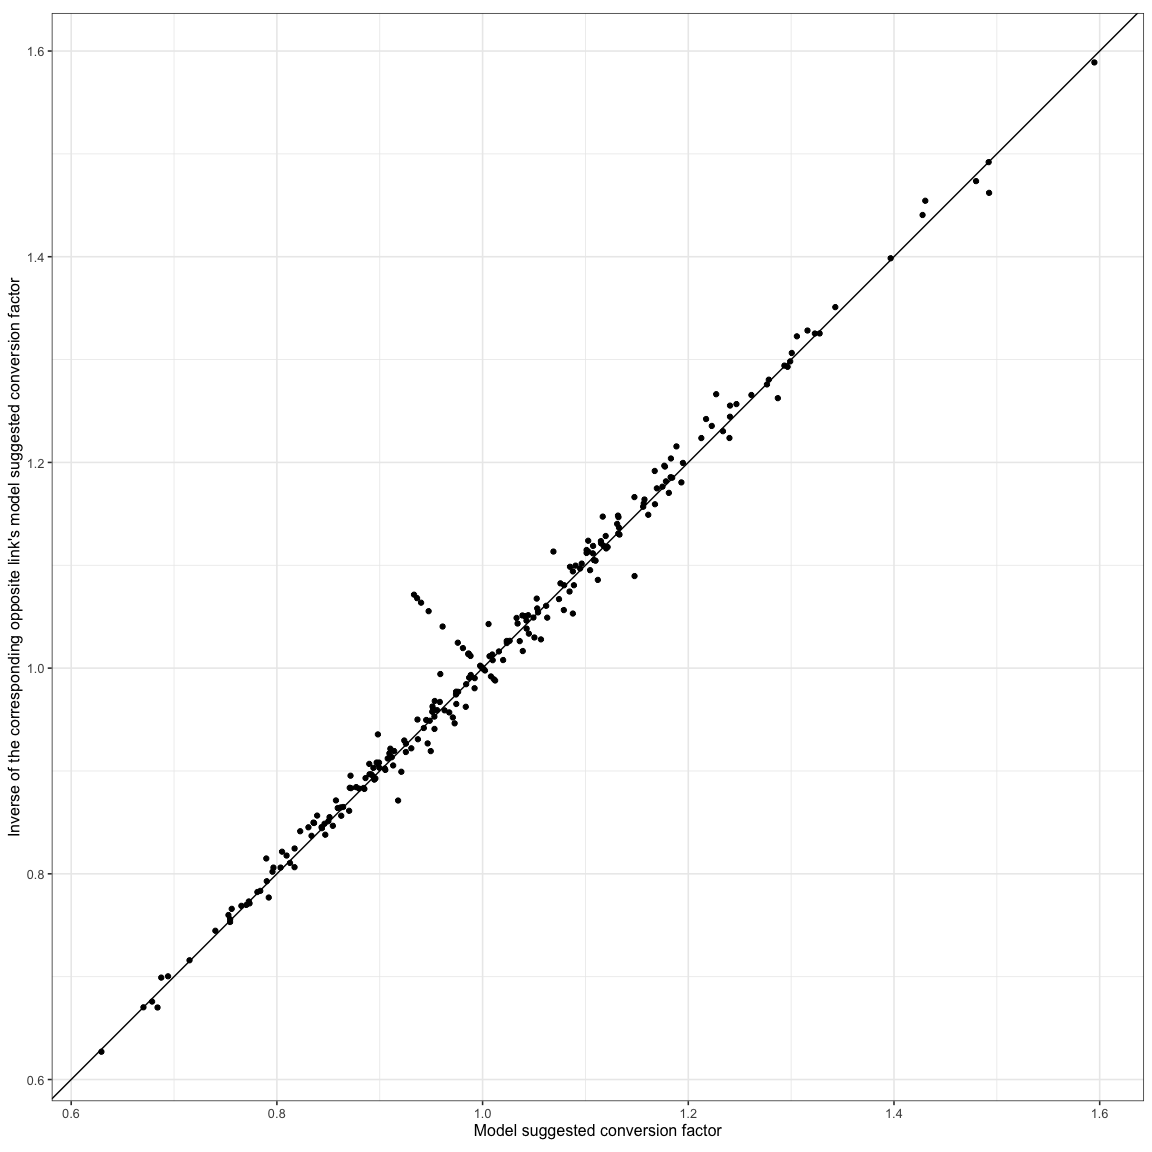
They lie pretty much along the x = y line indicating that even though we didn’t force the model to keep the inverse relationship, the calibration reached a solution which upheld that relationship.
This is how much the model suggested conversion factors differ from the observed factors.
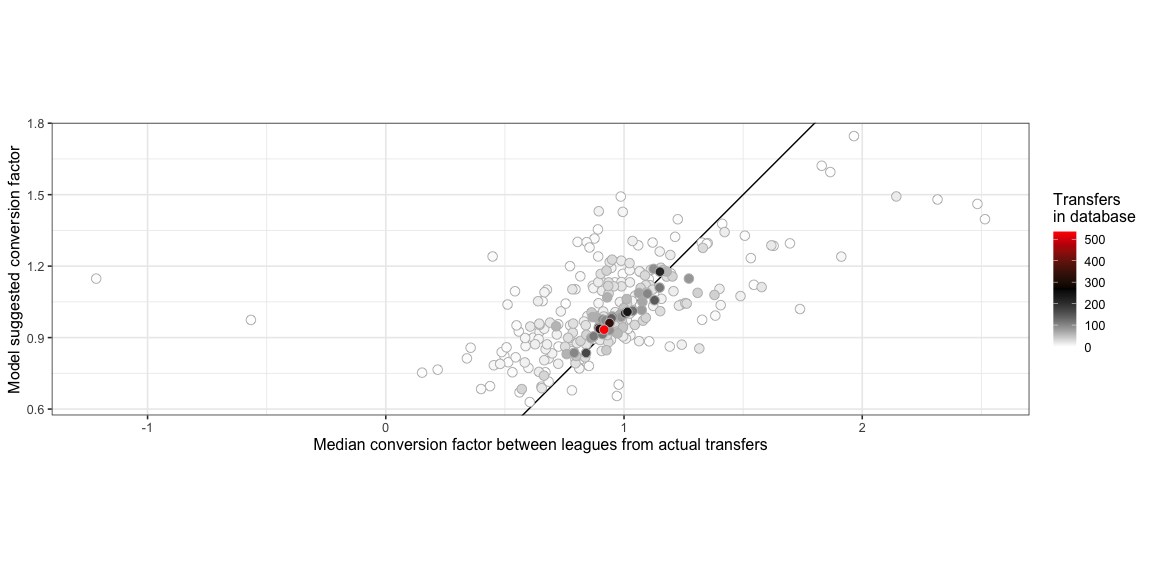
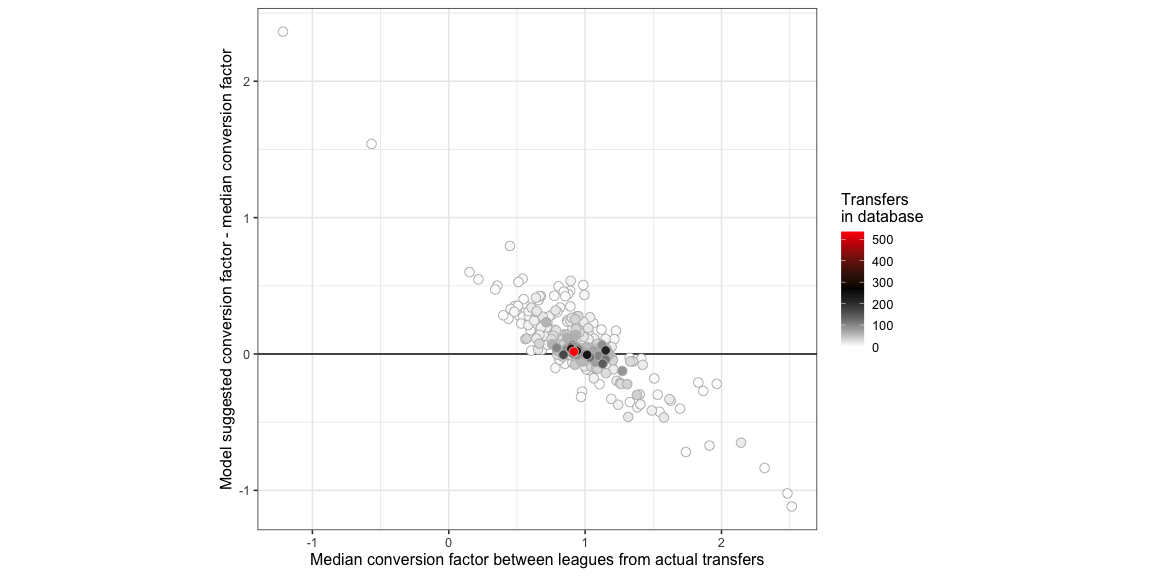
Pairs of leagues which have seen lots of transfers between them have very similar values from the model and observation, which is a good sign. A good side effect of our calibration approach is that the model has chosen to dampen the cases where it say unusually high or low conversion factors, which is often between pairs of leagues which have seen very few transfers and therefore low confidence. I kept the recency aspect out of this chart just for easier interpretation but we keep recency also as an input in how we decide confidence in the model.
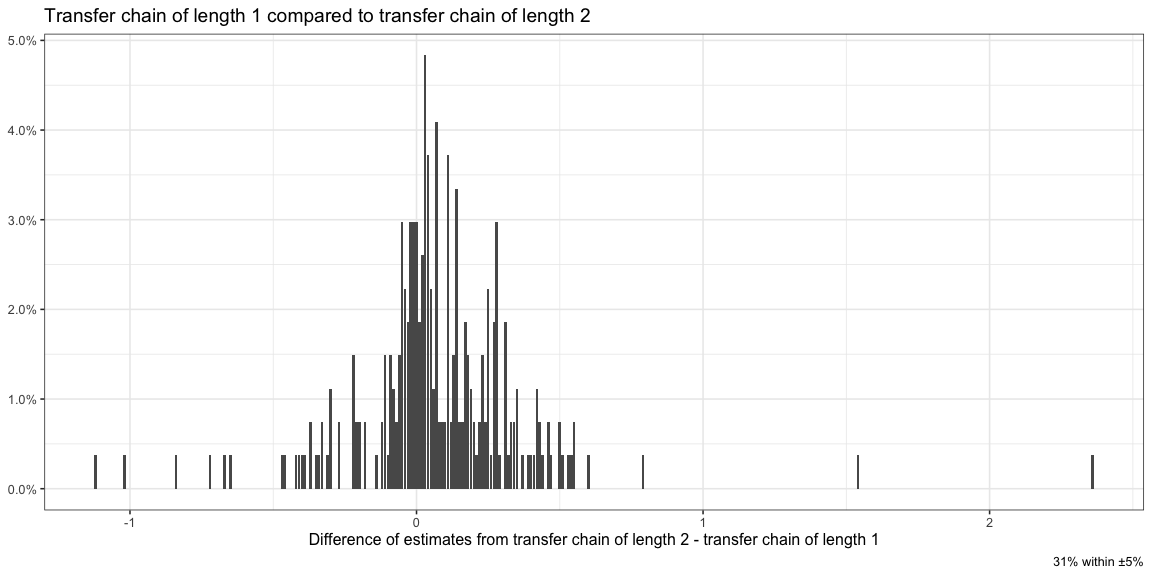
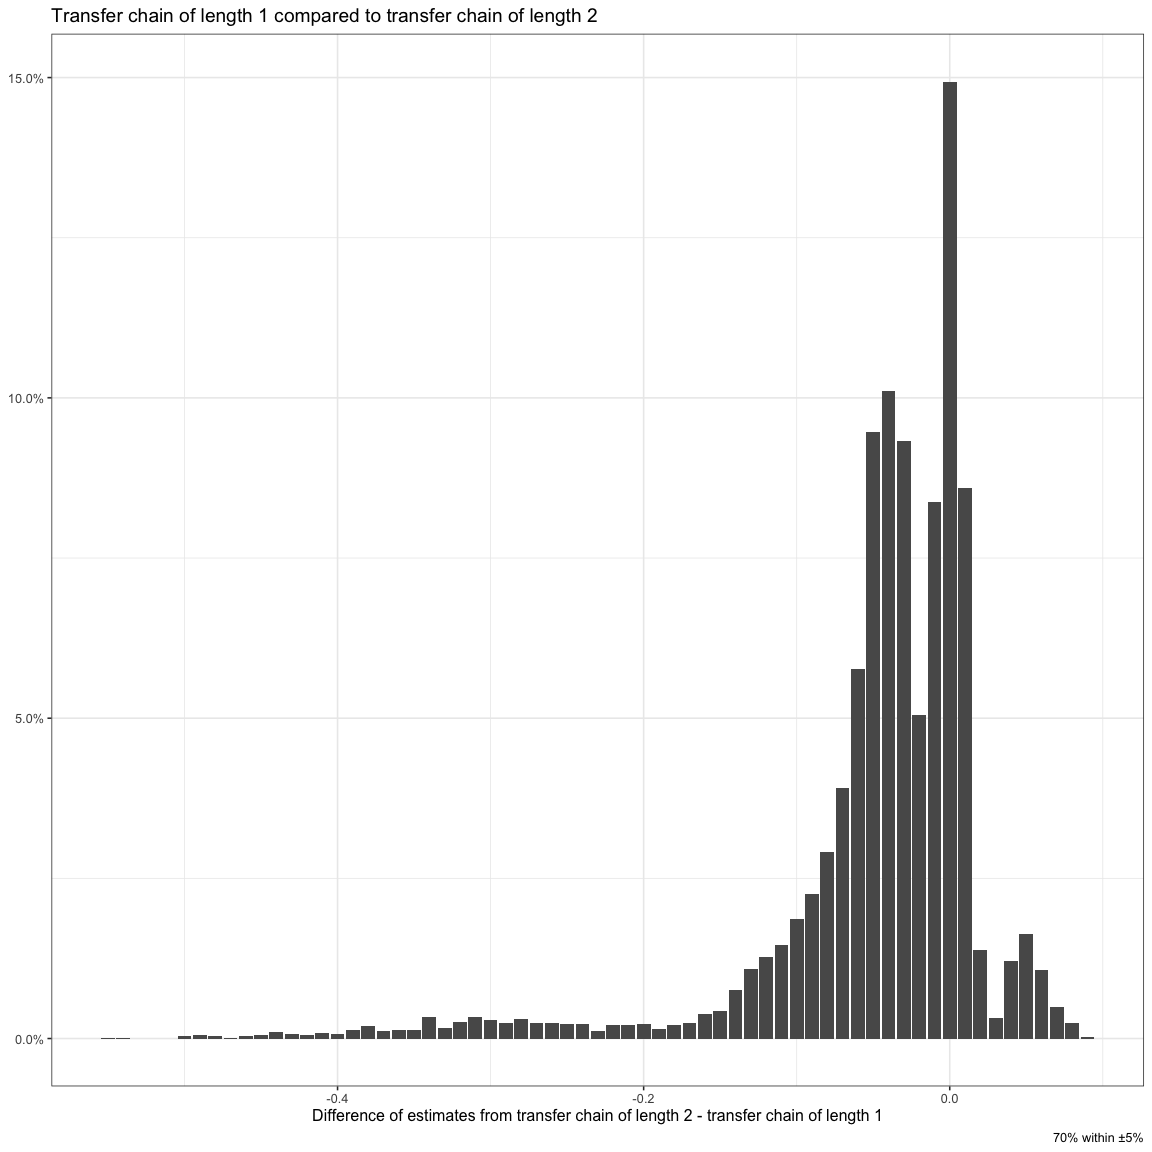
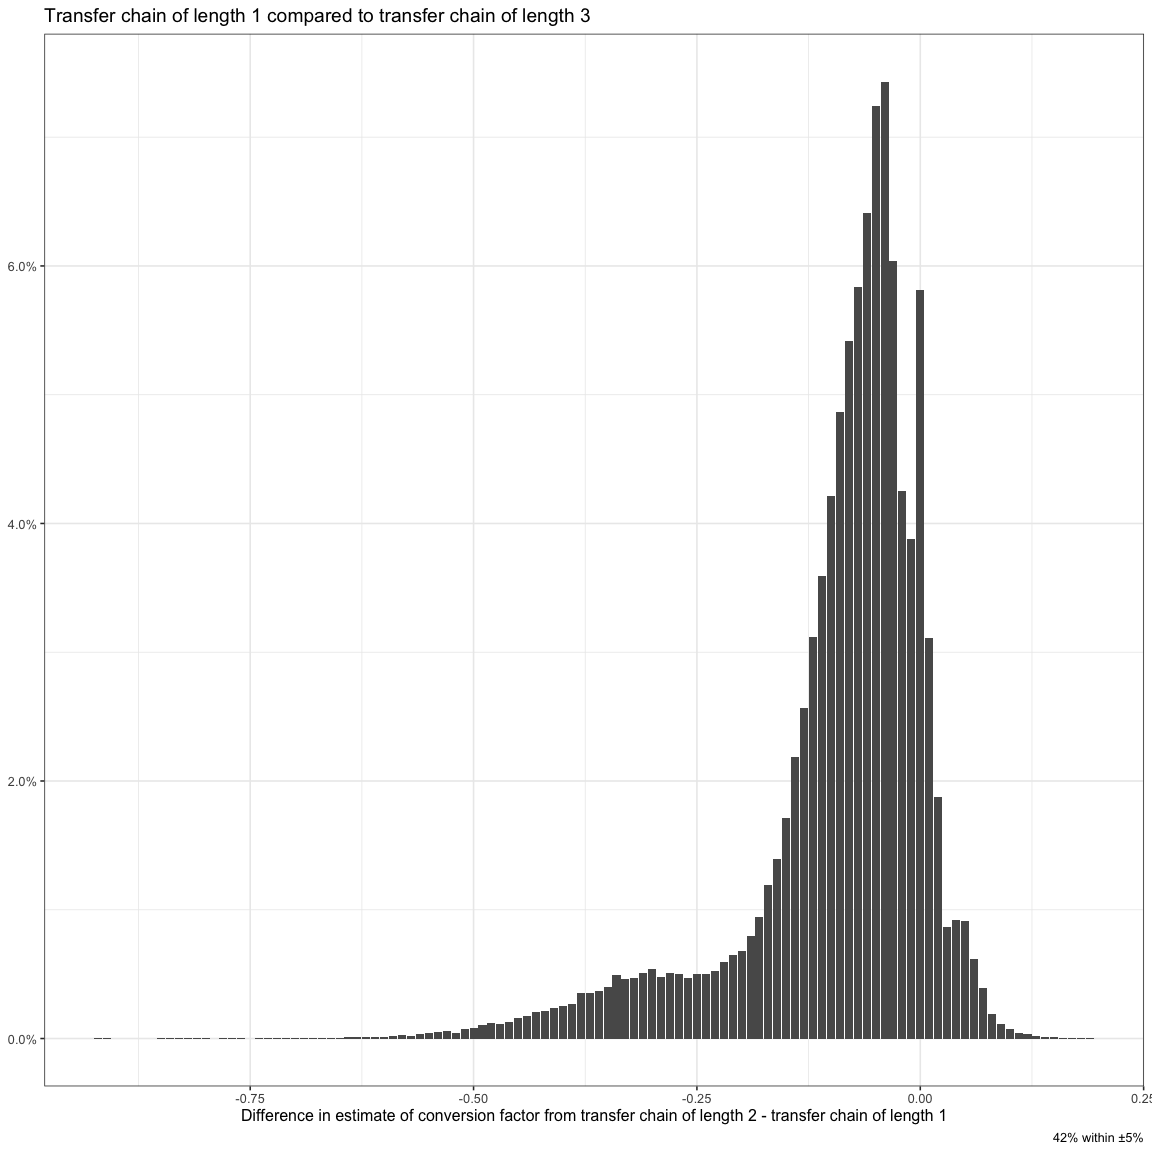
Let us look at the other criteria of comparing the conversion factor between two leagues based on the various ways in which players could move between those two leagues. We will do this by comparing the conversion factor directly from league a to league b with the combined conversion factor of all other ways in which a player could move between league a and league b, eg. league a -> b compared to league a -> c -> b, league a -> c -> d -> b, etc.
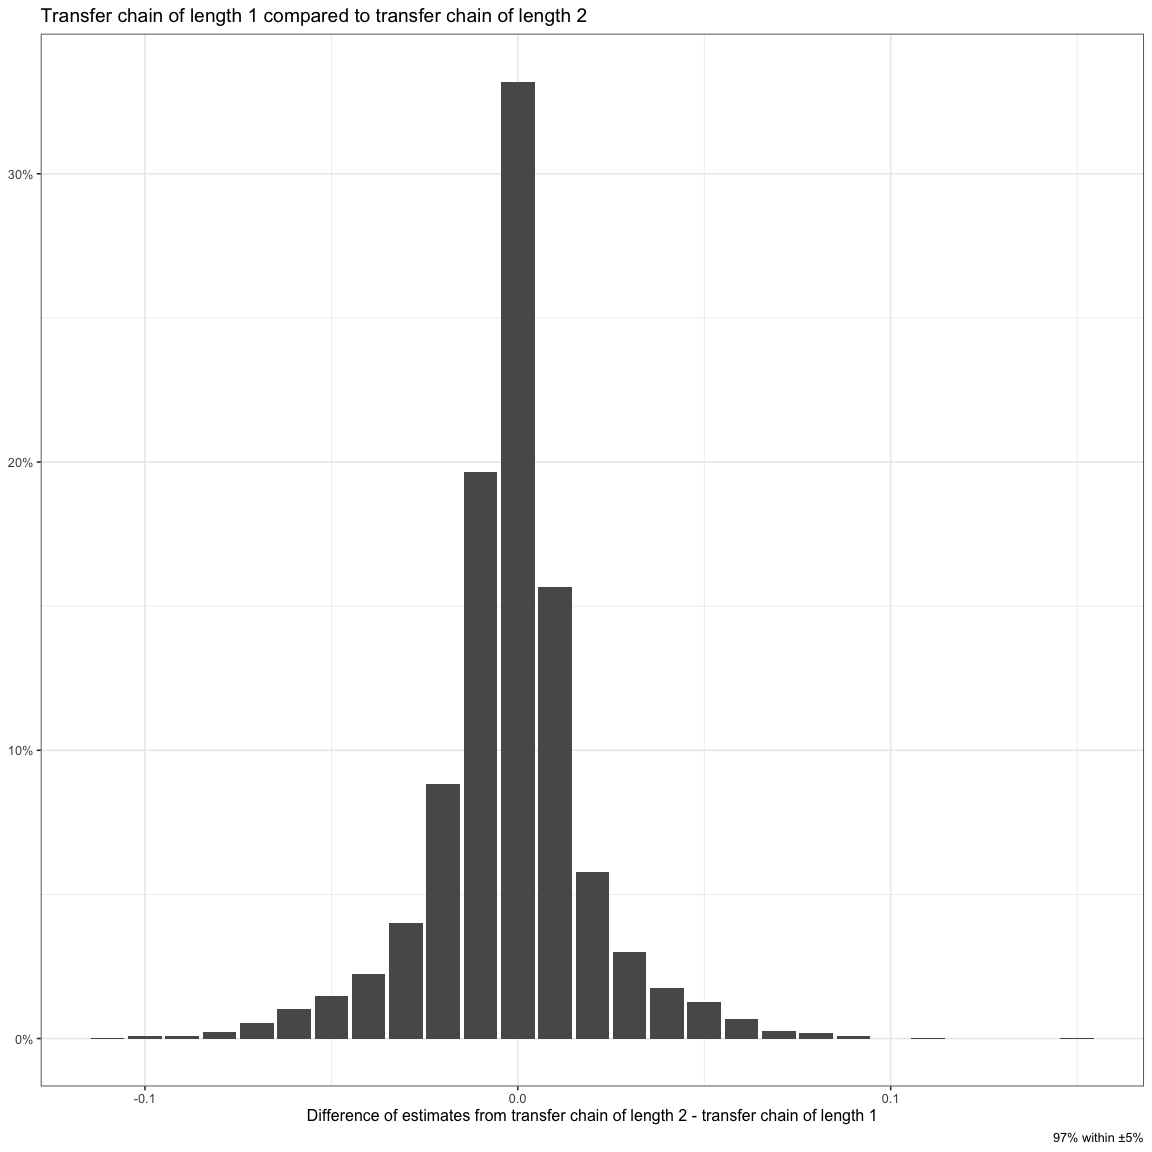
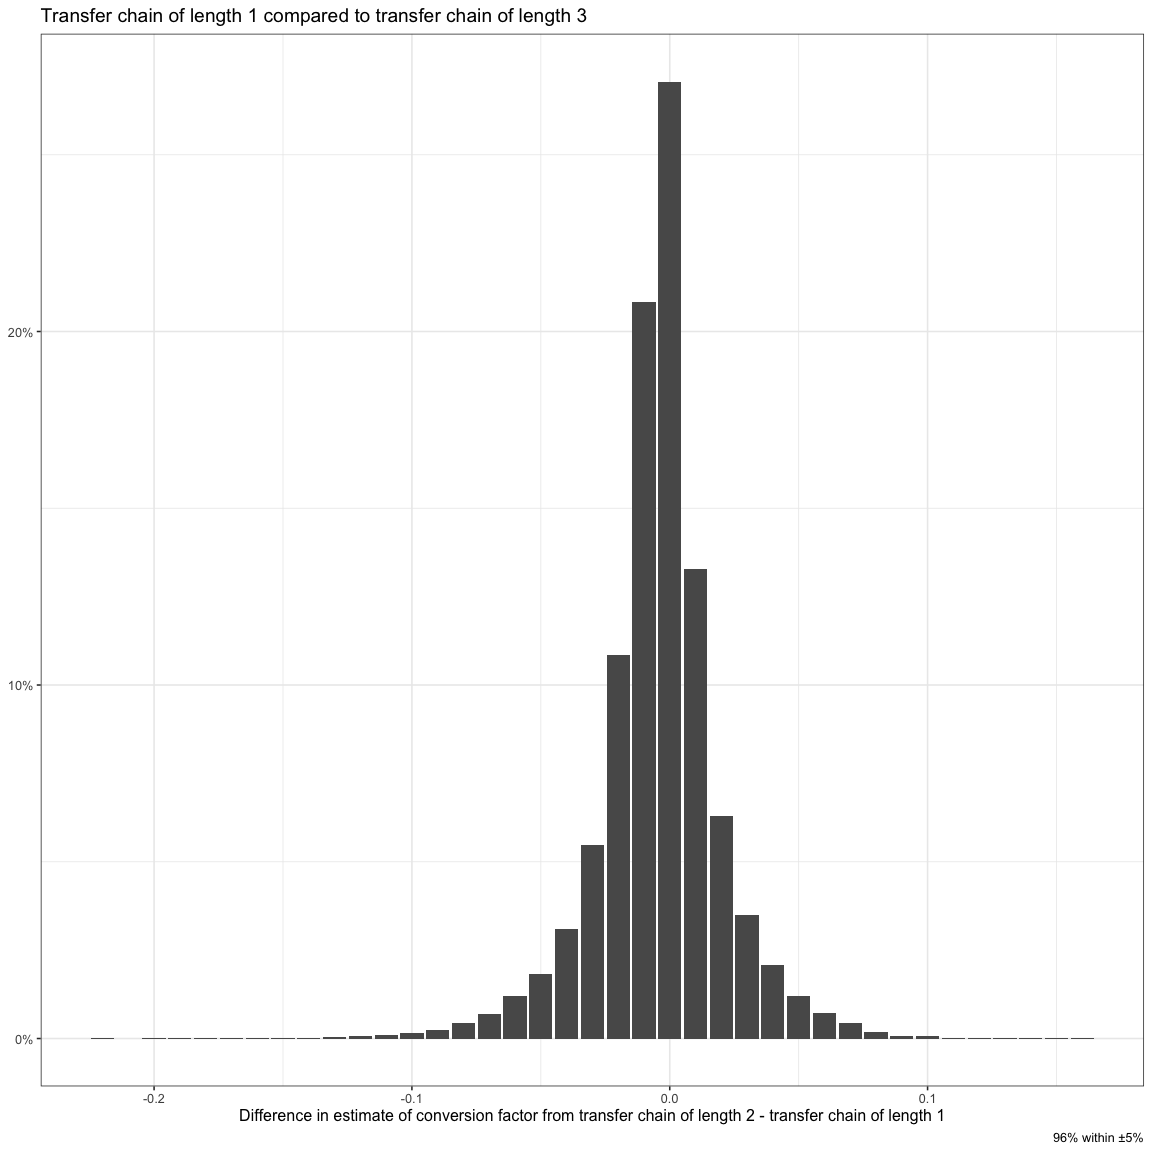
The differences are usually very low which means our model was able to arrive at a solution where all the links were consistent with each other and in terms of independence of the transfer chain between two leagues.
How To Use This
This is a very limited model. It is useful but limited. It is limited because it models the VAEP conversion factor of players who have moved between leagues which may or may not be a good estimate for a random player moving between leagues. Players who have moved are not a random sample of players so it is a biased view.
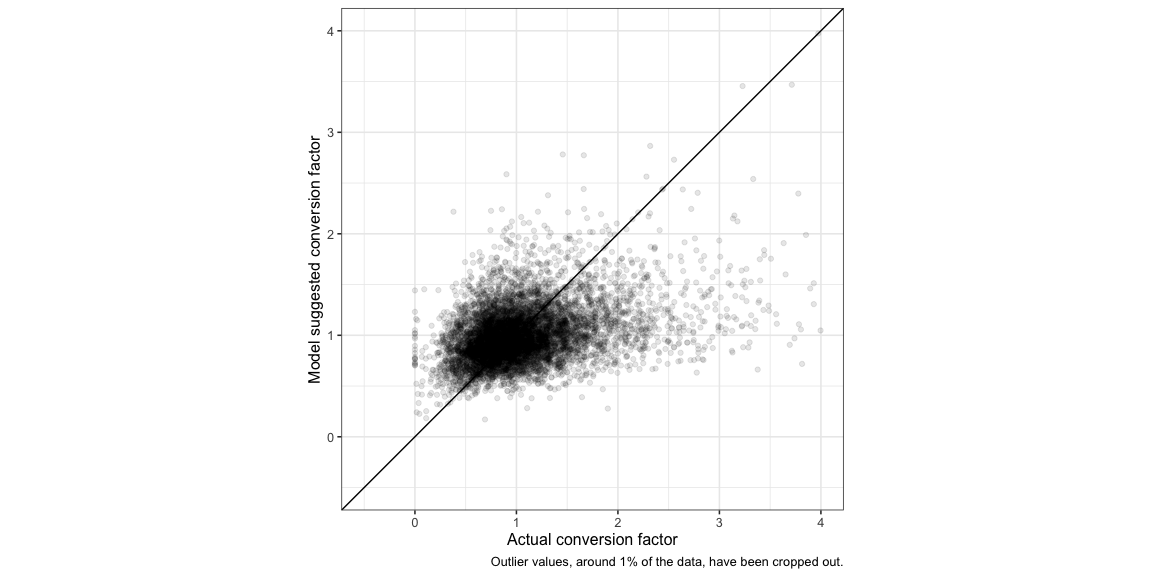
It might also just be useful as a macro model and not useful to predict the VAEP we can expect from specific transfers. Remember we’re predicting the median conversion using this model. Here is how the observed VAEP conversion for each individual transfers compares with the median suggested by the model.
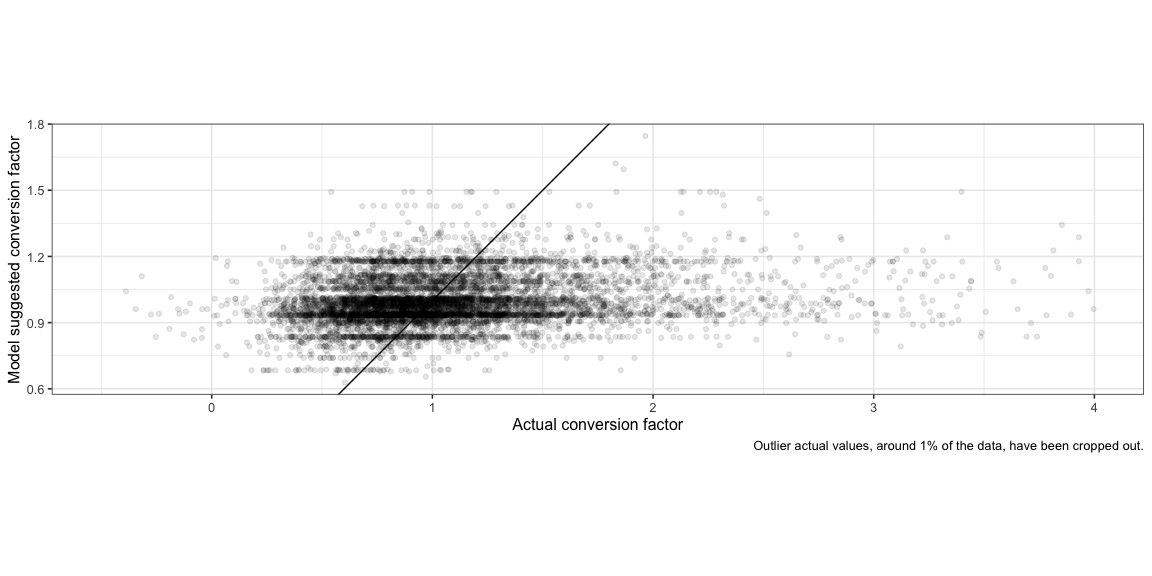
The general trend is reflected in the model’s values but there are large deviations. You should expect Depay’s output to fall to 90% of his current output but you can’t be sure.
I’ve been trying to model this difference too but no success yet. In good news though I also included inputs in this model to check if our assumption of a -> b being similar to a -> c -> b was wrong but there is no indication for that either yet. You win some you lose some.
Another Simplified Model
An easier model to calibrate would be where each league has a from conversion factor, for when the player transfers out of the league, and a to conversion factor, for when the player transfers to the league. The conversion factor for a transfer between those two leagues is a product of the two conversion factors.
You can take logs and convert it to a linear equation, log(1/from league a factor) + log(to league b factor) = log(conversion factor), and then solve it as a linear regression. We could also try having just one factor for each league and using it and its inverse as a to and from but same logic as earlier, this will allow for an independent relationship between those two so we’ll keep them separate.
An example of the dataset we’ll give to linear regression for our first example for a transfer between the EPL to the La Liga would look like this -
| from_EPL | from_LaLiga | from_Ligue1 | from_SerieA | to_EPL | to_LaLiga | to_Ligue1 | to_SerieA | conversion_factor |
|---|---|---|---|---|---|---|---|---|
| -1 | 0 | 0 | 0 | 0 | 1 | 0 | 0 | 1.2 |
There would again be an extra weight to take into account the recency of the transfer, where we give more importance to recent tranfers and less importance to older ones. Each transfer is now fed independently into this model, as compared to the earlier model where we sent medians, so we don’t need to explicitly incorporate the count of transfers between leagues.
One problem that there is though that you can’t take logs of negative values but we have very very few negative observed conversion factors ( i.e. cases where overall VAEP was negative ) so we’ll just ignore them for now.
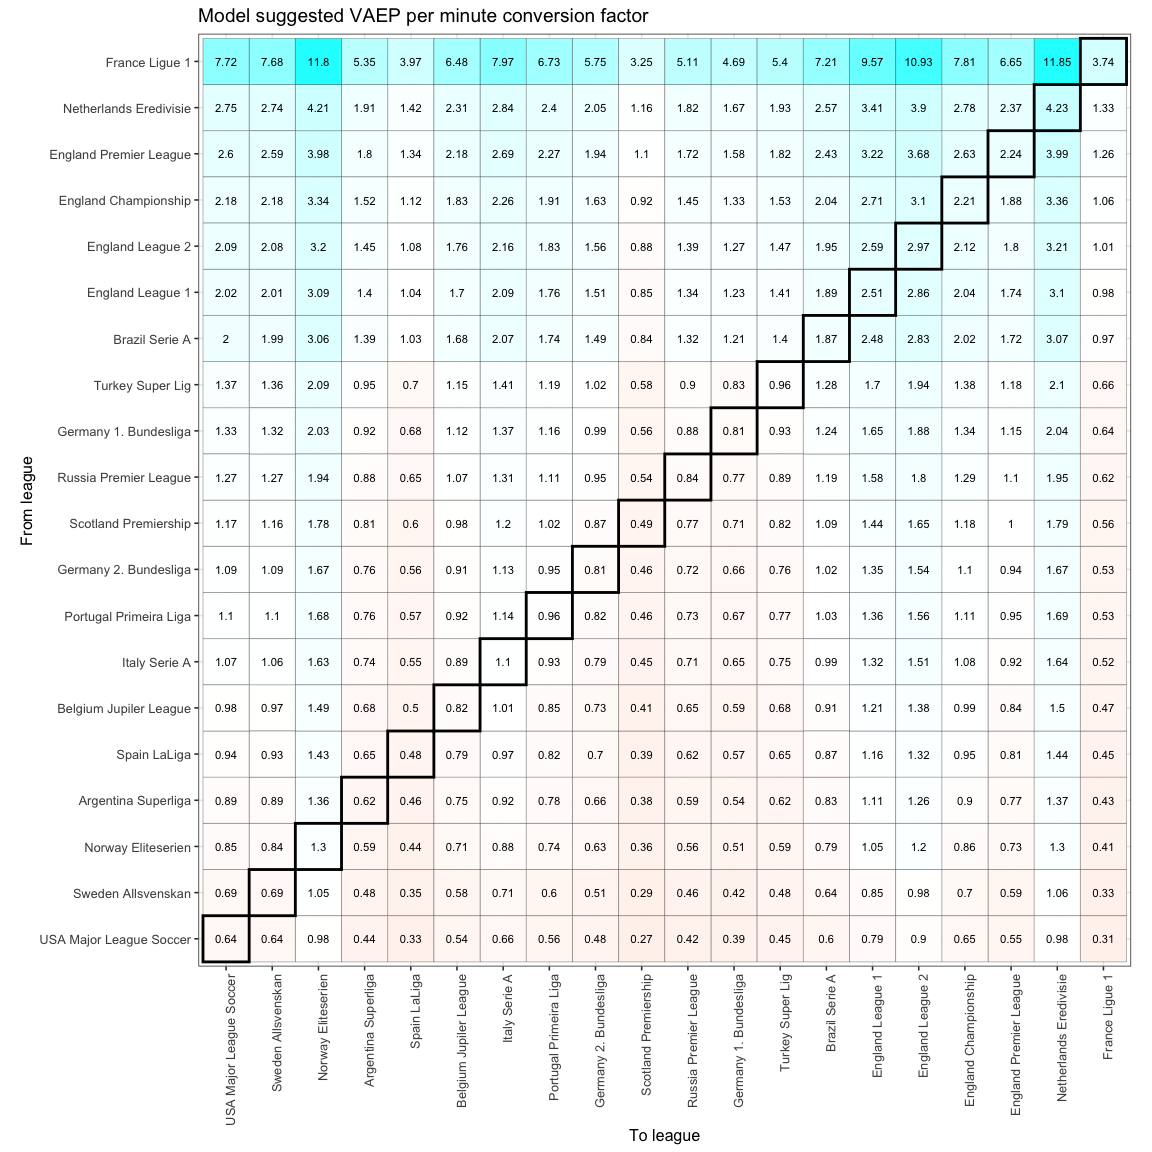
Here are what the results for this simple model look like. They are quite similar to our earlier model and probably worth it for the ease of calibrating this.
So now that we have a to factor and a from factor for each league, as compared to have a separate relationship between each pair of leagues, we need to look at this matrix a little differently. The values along the rows are representative of the from factor, and the values along the columns representative of the from factor. Scotland’s Premiership and Russia’s Premier League are interesting because its values along its rows suggest that most players that transfer from that league to other leagues have a <1 conversion factor but players coming to those leagues from most other leagues also have a <1 conversion factor. This means that these leagues are probably tough to play in even if players are coming from other leagues considered higher quality leagues.

Adding Other Factors to the Simple Model
Now that we have a simple model which is easy to calibrate, let us see if we can add more granularity to it. This is again with a view to bridging the variance of the actual conversion values compared to the overall prediction between a pair of leagues.
This hasn’t been very successful though so don’t keep your hopes up for the rest of the article.
Let’s add variables to this dataset which captures the teams which works the same way as the league variables, a -1 in the from_team column and a +1 in the to_team column and try and regress this. The coefficients aren’t individually as strong a predictor anymore though because there are a lot more variables that the model is trying to split the effect on the output amongst many more input variables.
Here is what the league comparison looks like with this model.
That isn’t very good. Sigh.
I really want this model to work because unlike earlier where we were trying to predict the median, this uses individual transfers and has context of the teams so if one team makes many more transfers than another team in the same league then the first team will have a much higher influence on the median for the league which will distort the typical expectation from that league. What I’m going to do is add a small regularisation penalty to avoid coefficients becoming too large away from 1. Let’s see what this looks like now.
Much better. More believable although quite different from our first result. The difference is not a bad thing though because now we’re including team effects whereas earlier we were ignoring it. I’d probably trust this model more than the earlier one. We could probably do some more fine tuning but it is reasonable right now so let us proceed.

The predictions are still not great though.
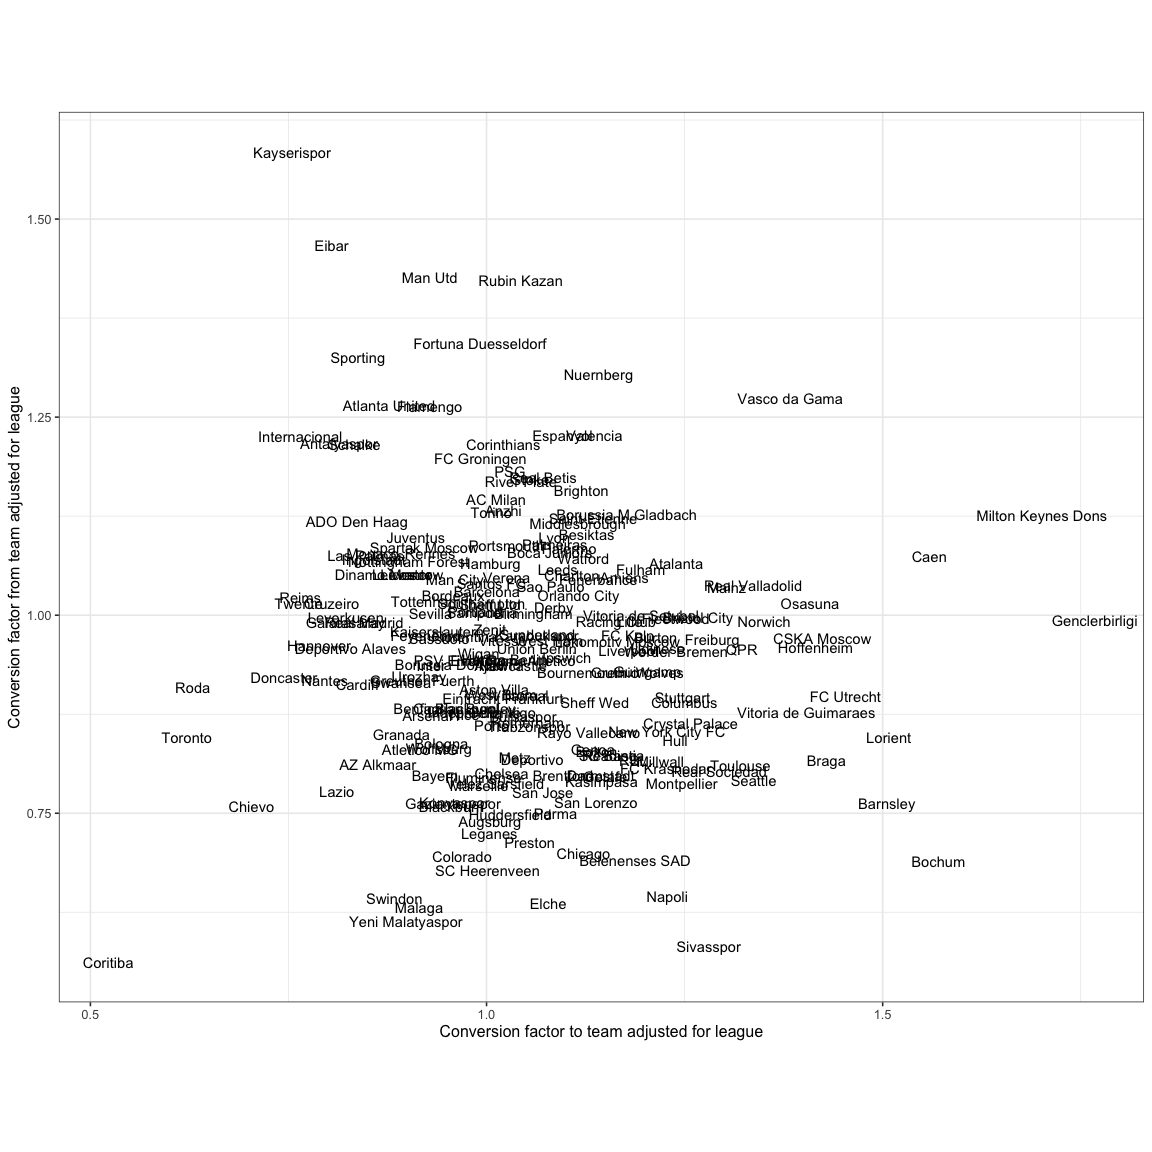
Now is a good time for us to drop interpreting these coefficients as an indicator of league or team strength and go back to seeing them as what they should be seen as - an indicator of how well players perform after transfers. In this case, since we have modelled the difference from the league based predictions, this is really a measure of how well the players do after transfers after adjusting for the change of league. Amongst teams that have had at least 5 transfers to and from them, here is how the coefficients look -
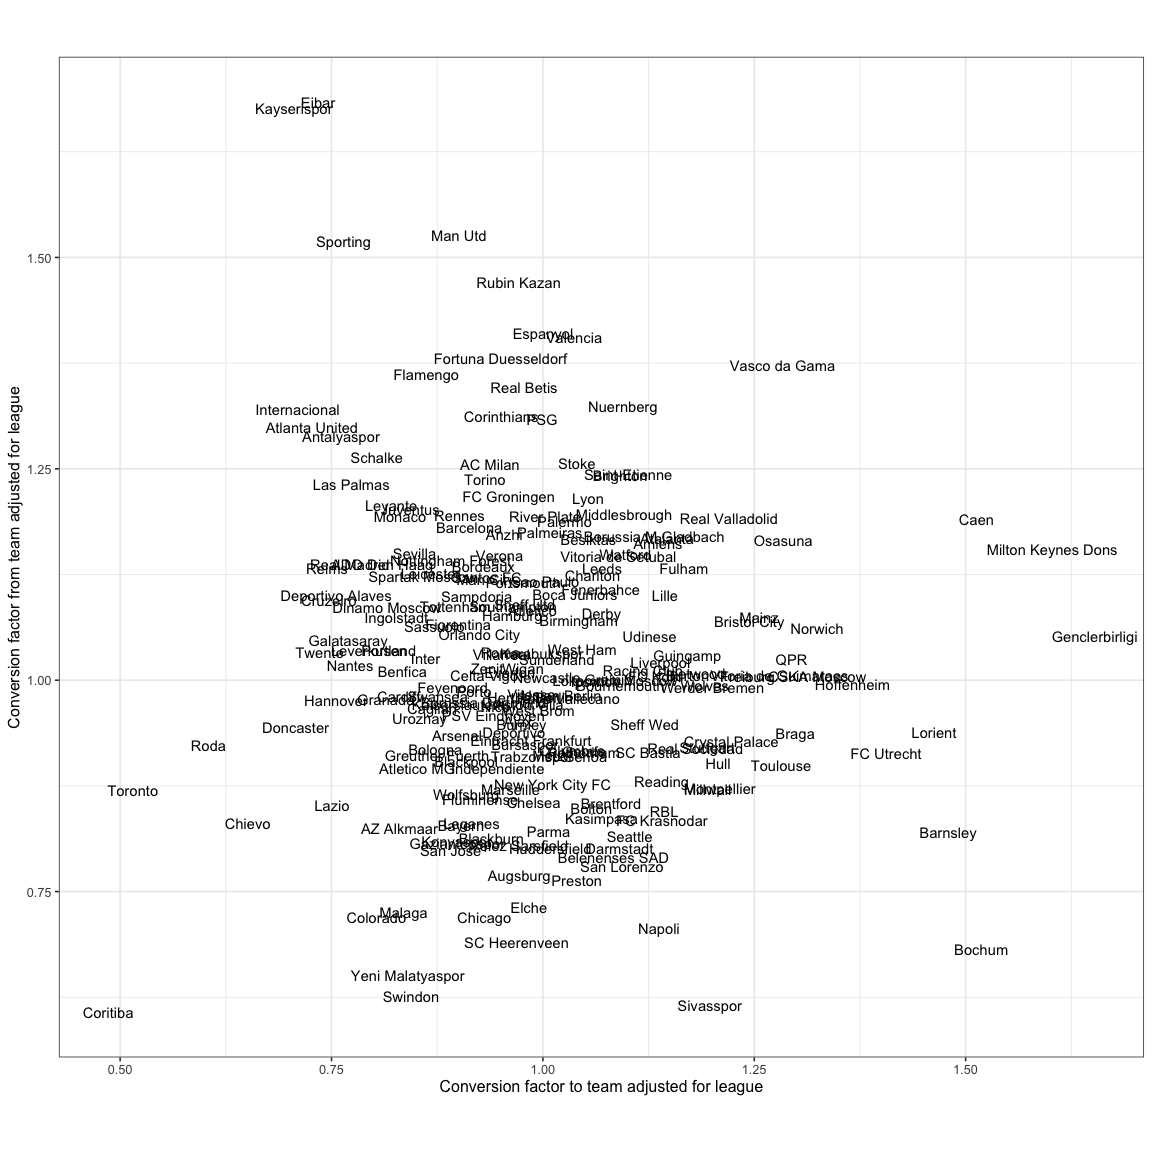
I can think of some interpretations for this plot:
- teams on the bottom right are likely coached very well since players coming to them play much better than their previous teams while players players leaving them typically see their output drop after adjusting for league change
- teams on the top left are the opposite - likely coached very poorly
- teams on the top right are teams that typically get players on their way up, they typically see players improve when they come to the team and when they leave the team after adjusting for league change
- teams on the bottom left are teams that typically get players on their way down
Some of the names make sense against this description but maybe not all of them. That said, the model is again not confident about most of the coefficients and therefore you should expect a large case to case variance around this prediction, which is what the earlier plot of the prediction vs. actual conversions for this model was also suggesting.
Adding Other Factors to the Simple Model - 2
Instead of regularising, I tried another thing where I hold the the league level coefficients constant from our simplest model and letting the team level variables account only for the difference between each individual transfer’s conversion factor and the league pair suggested conversion factor. This is mixed effects model territory.
The relationship between leagues would remain the same as the simple model so the coefficients for the teams is our focus here.
Based on the visual, there isn’t a large improvement in the predictions though. The model’s predictions of the coefficients are also often not very confident but let us take a look at them anyway.
Wrapping Up
I also tried adding features related to age, physical attributes, playing position, matches or time played, and experience from other leagues to see if they helped narrow the prediction down but no luck. Going to have to continue at my job for some more time, I guess.
For feedback, suggestions, etc. [find me on Twitter, @thecomeonman](https://www.twitter.com/thecomeonman) or drop me a mail - mail dot thecomeonman at gmail.