xG Based Infographics
Posting sums of xG over the game is a common practice on Twiiter. And it’s wrong. Probabilities are weird and just summing them is over simplifying it.
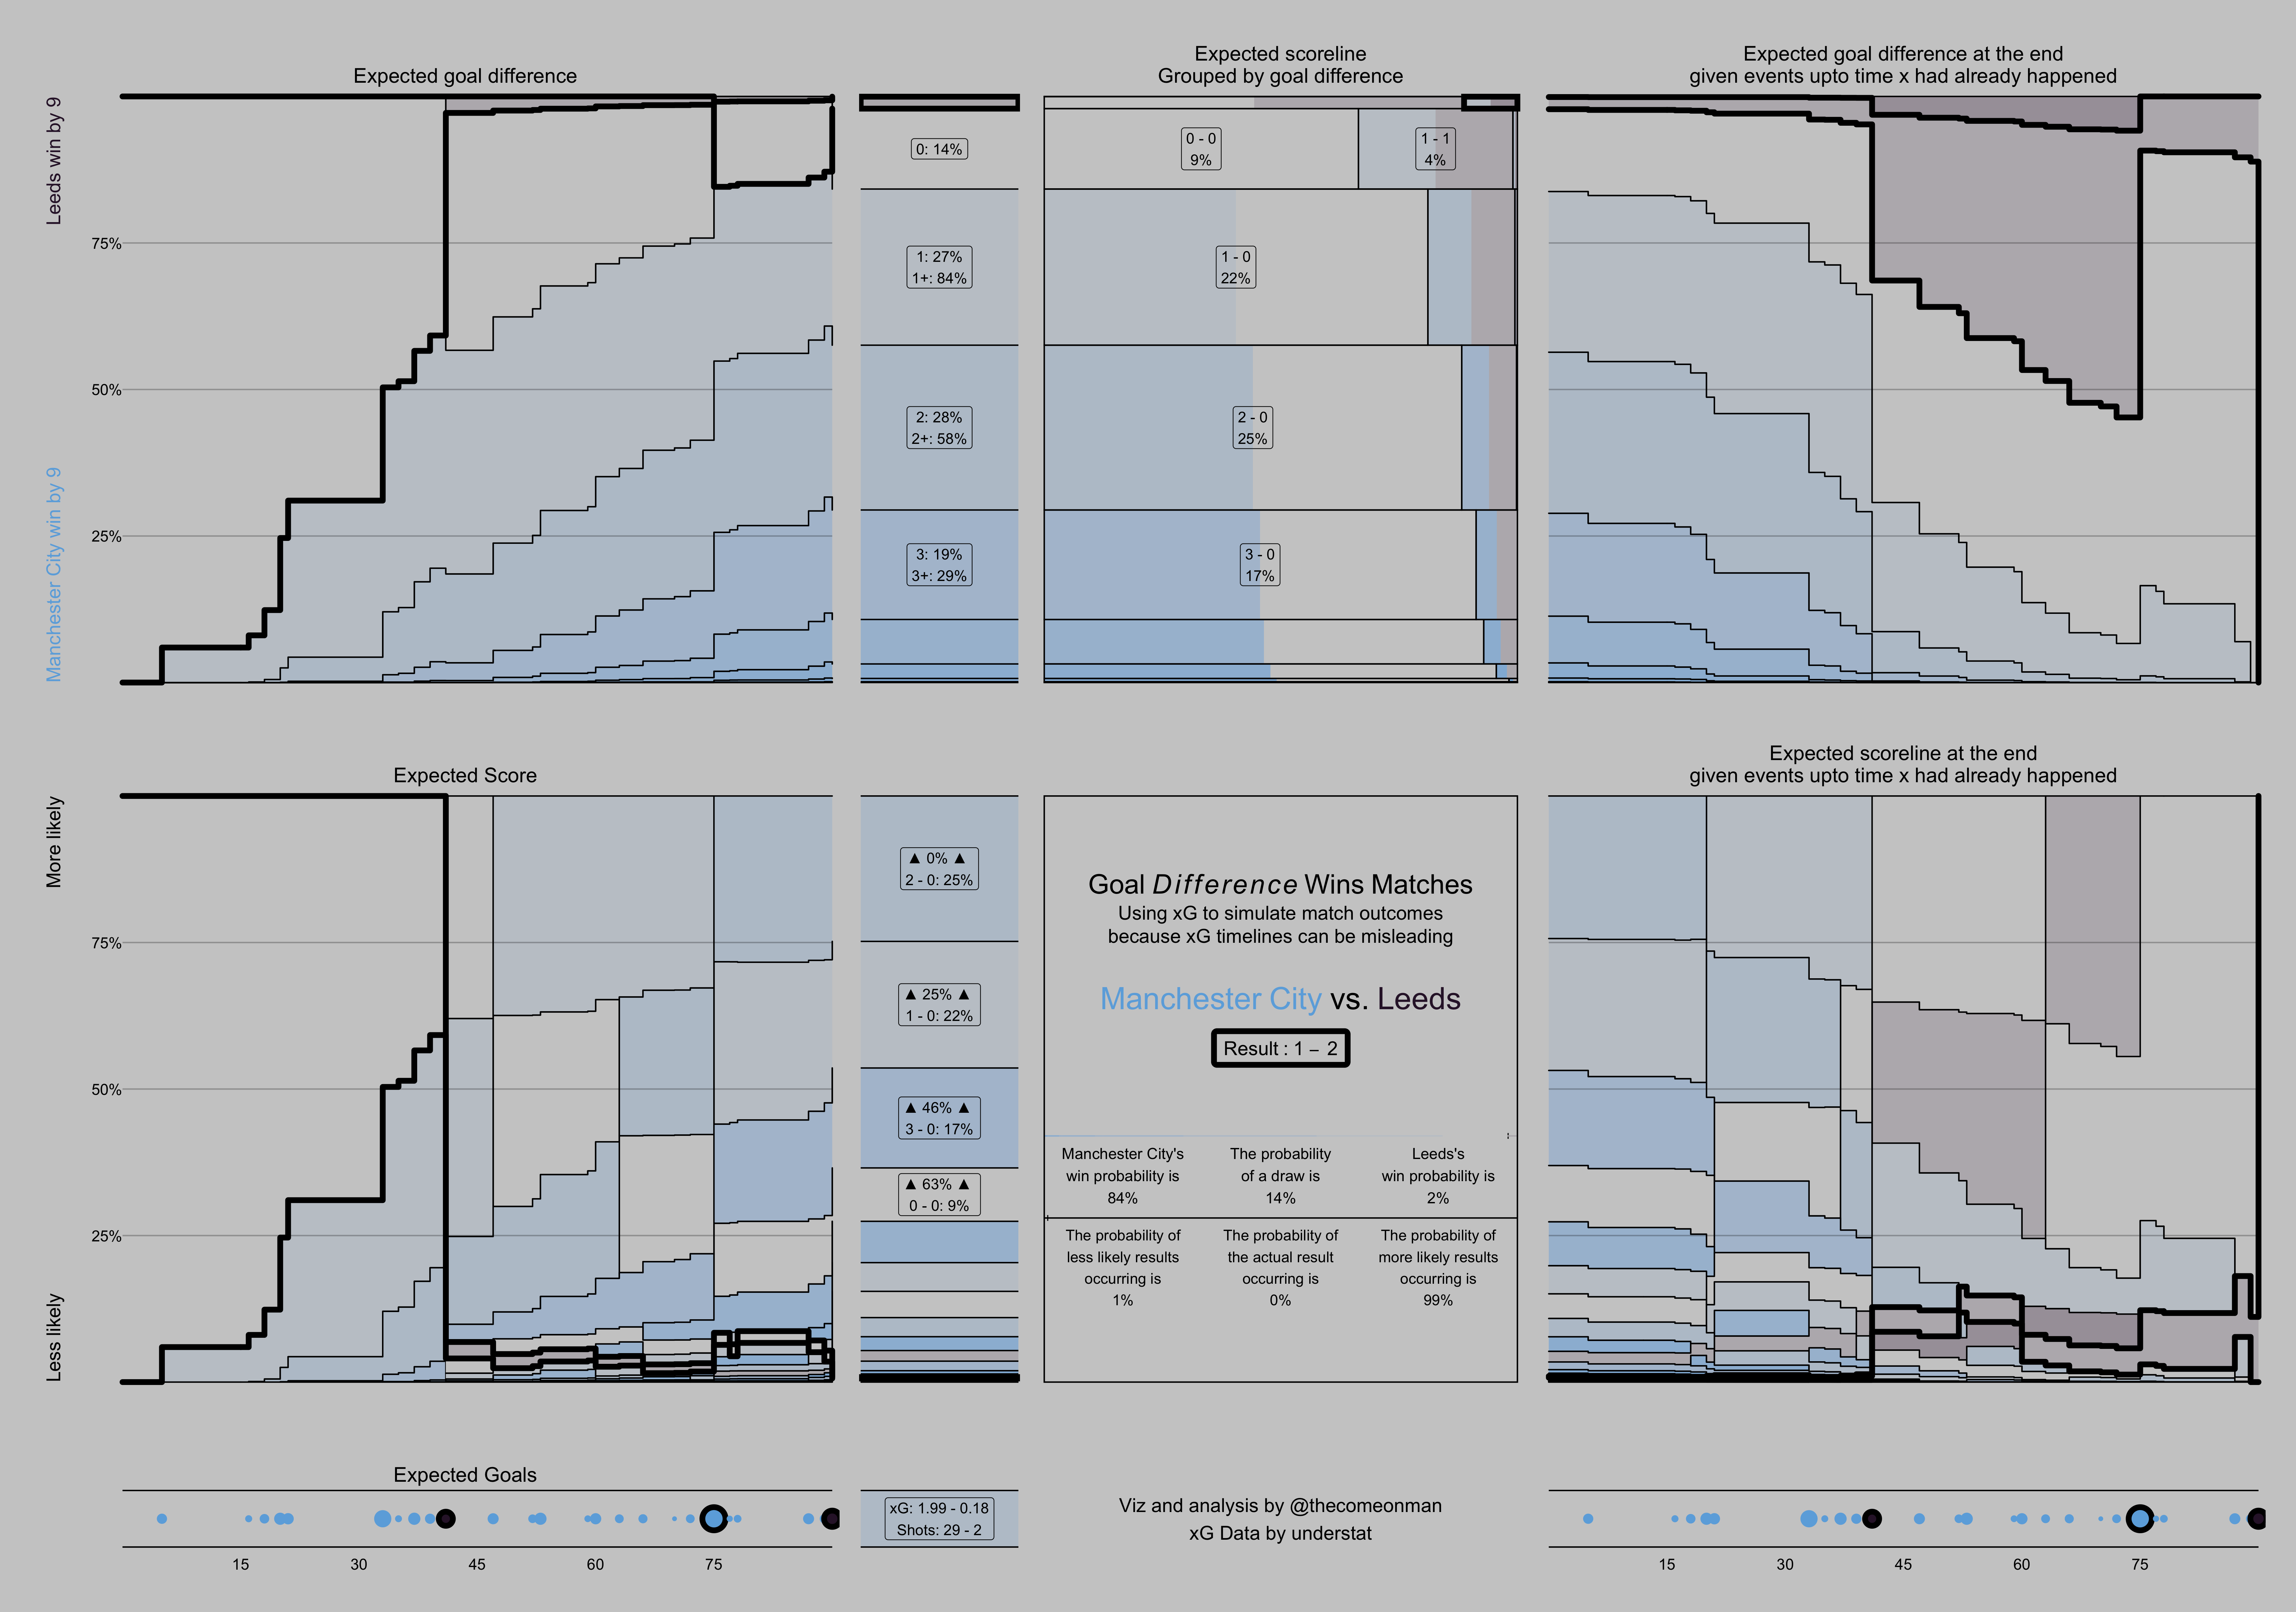
I have put together an xG based inforgraphic of a game. This is created after simulating the sequence of shots and the xG of each many many times over, recording each shot as a goal or not based on the simulation, and doing aggregations and rolling sums of the simulated goals.
This is not meant to be an easy to digest, Twitter friendly, kind of viz. That’s why I’m not calling it a viz. My objective is to get viewers to appreciate the nuance to using xG to predicting game results, and in general the nuance behind working with probabilities. xG totals and timelines is clearly terrific to get engagement on social media but you may not want to use it like that at your job. You don’t recruit players based on their pass completion percentage either, do you?