Category Urban policy
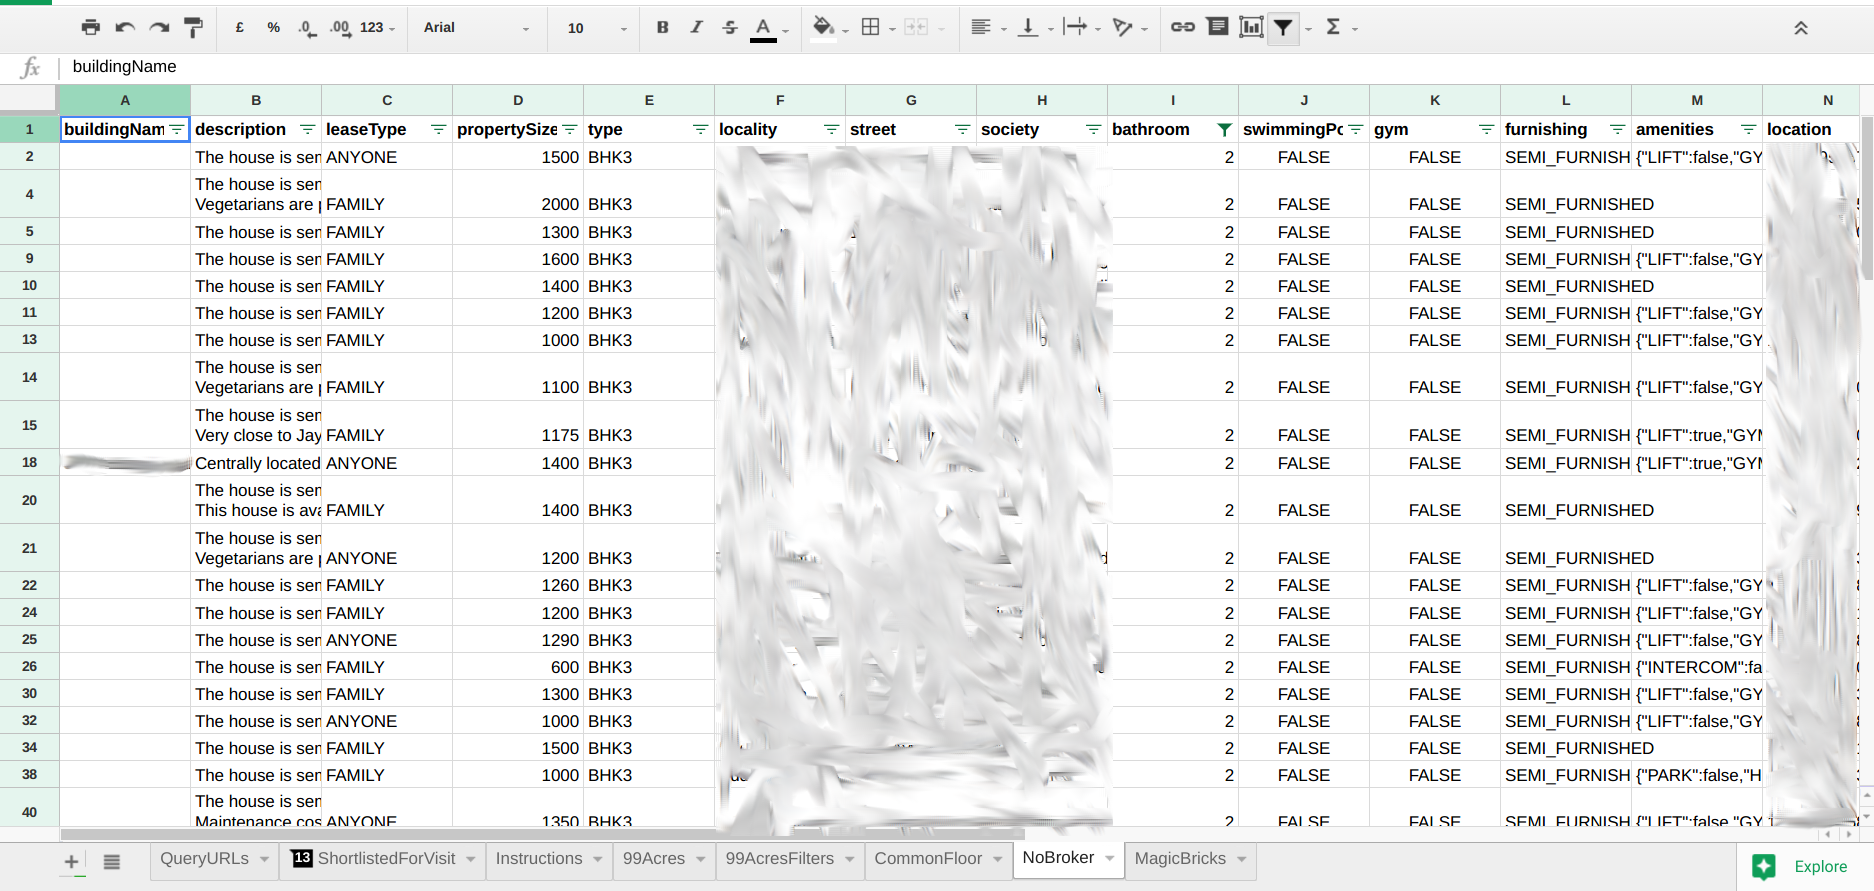
A script to scrape data from multiple house rental websites
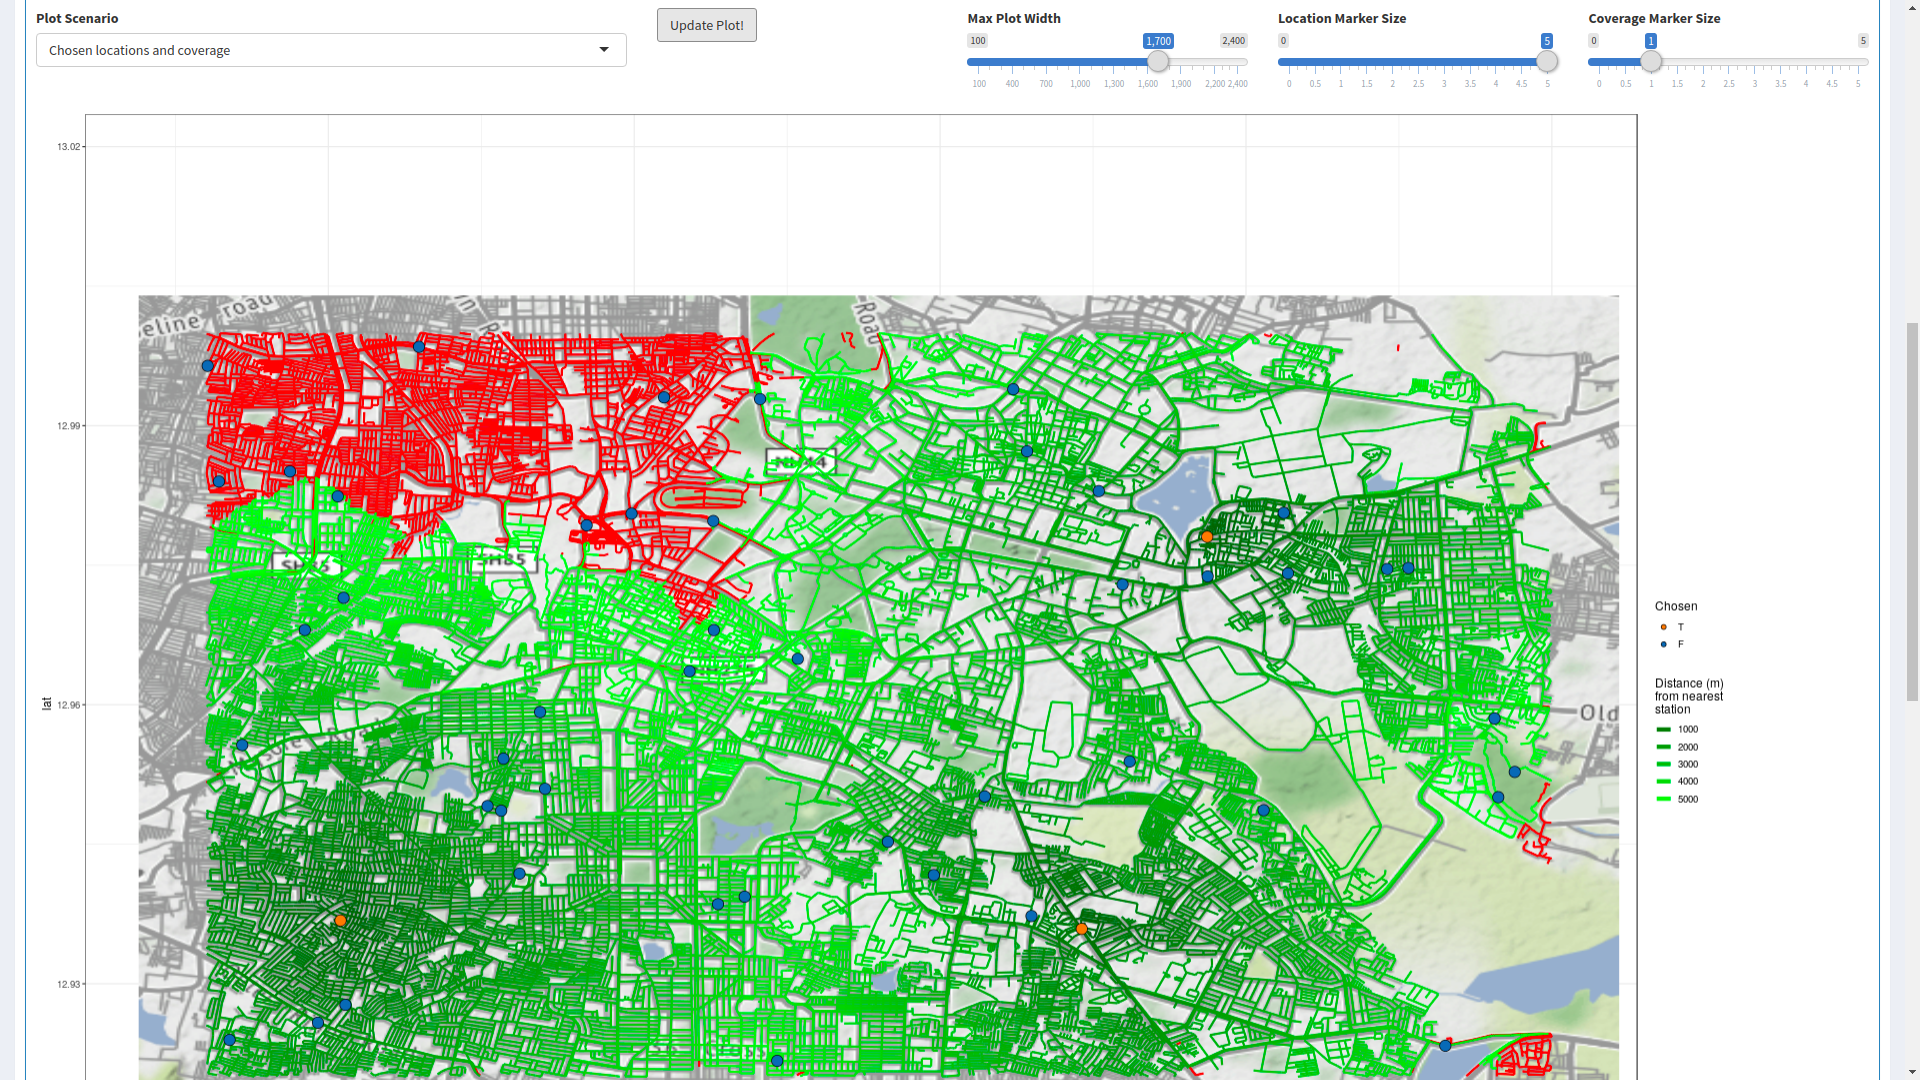
An R-Shiny based tool for solving the warehouse problem
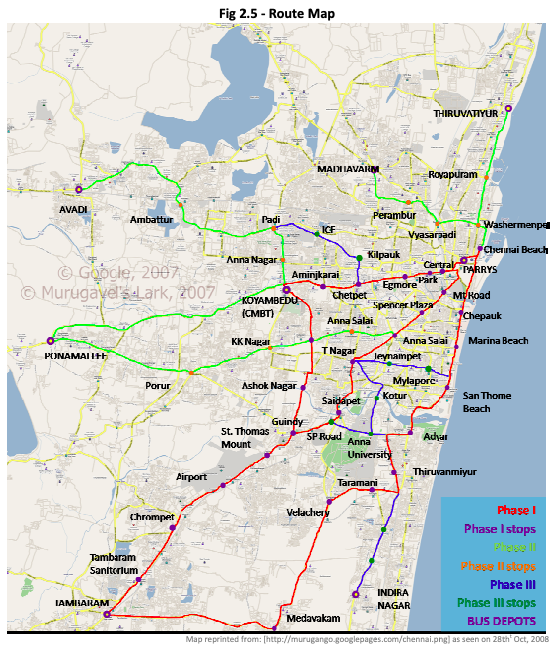
A pre-feasibility study for a bus rapid transport system in Chennai
Category Model
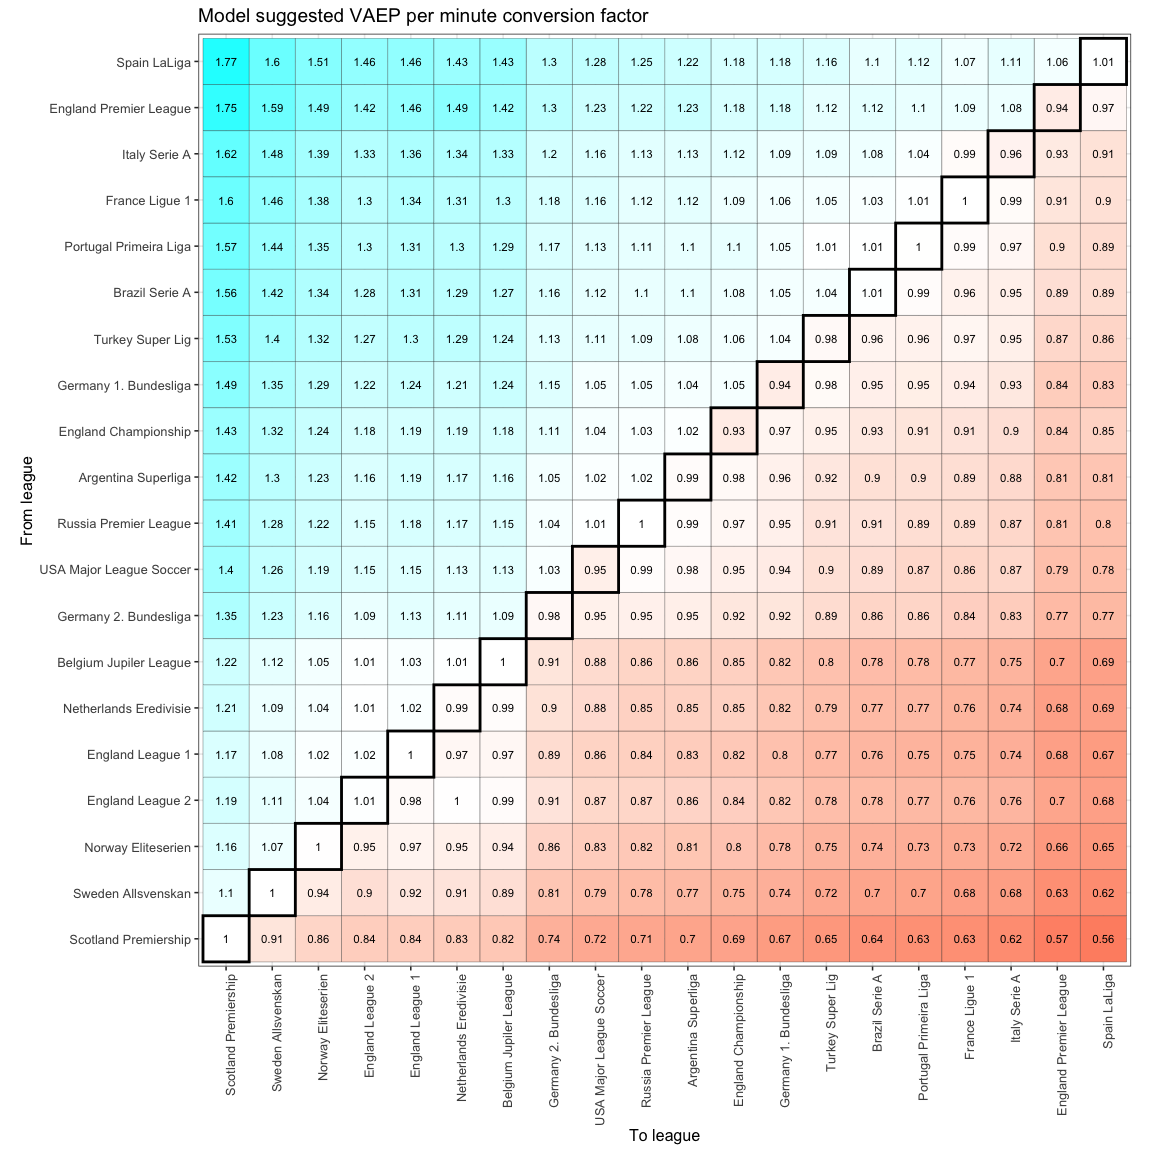
Trying to predict successful transfers using VAEP
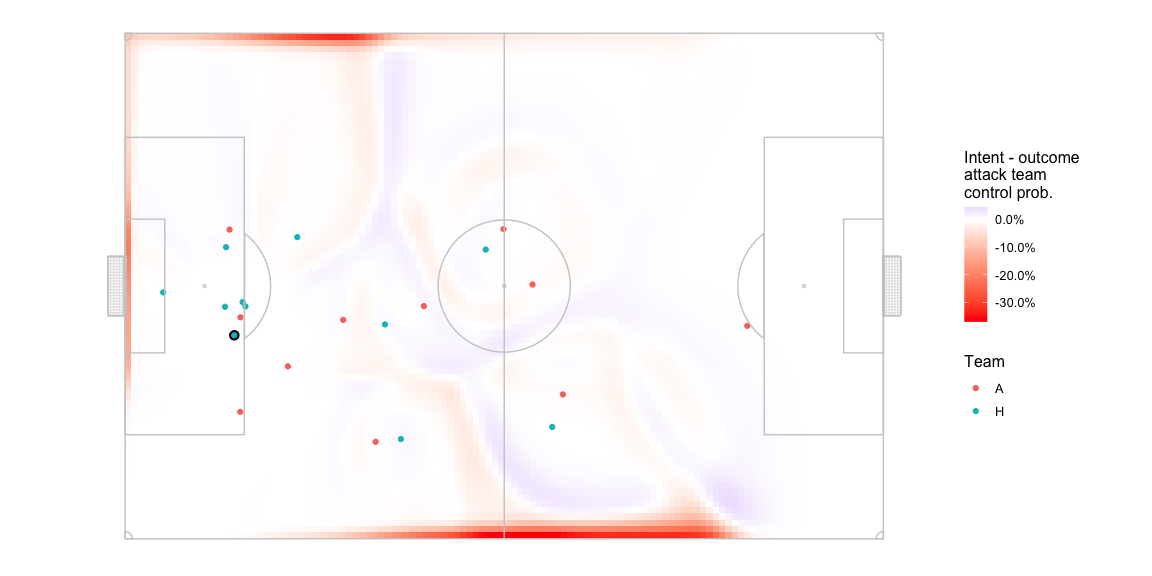
Most models seem to be outcome based. What changes if try to incorporate intent?
A model to quantify the impact of a player's actions beyond just goals and assists.
Finding similar players using match level aggregated data, such as passes attempted during the game
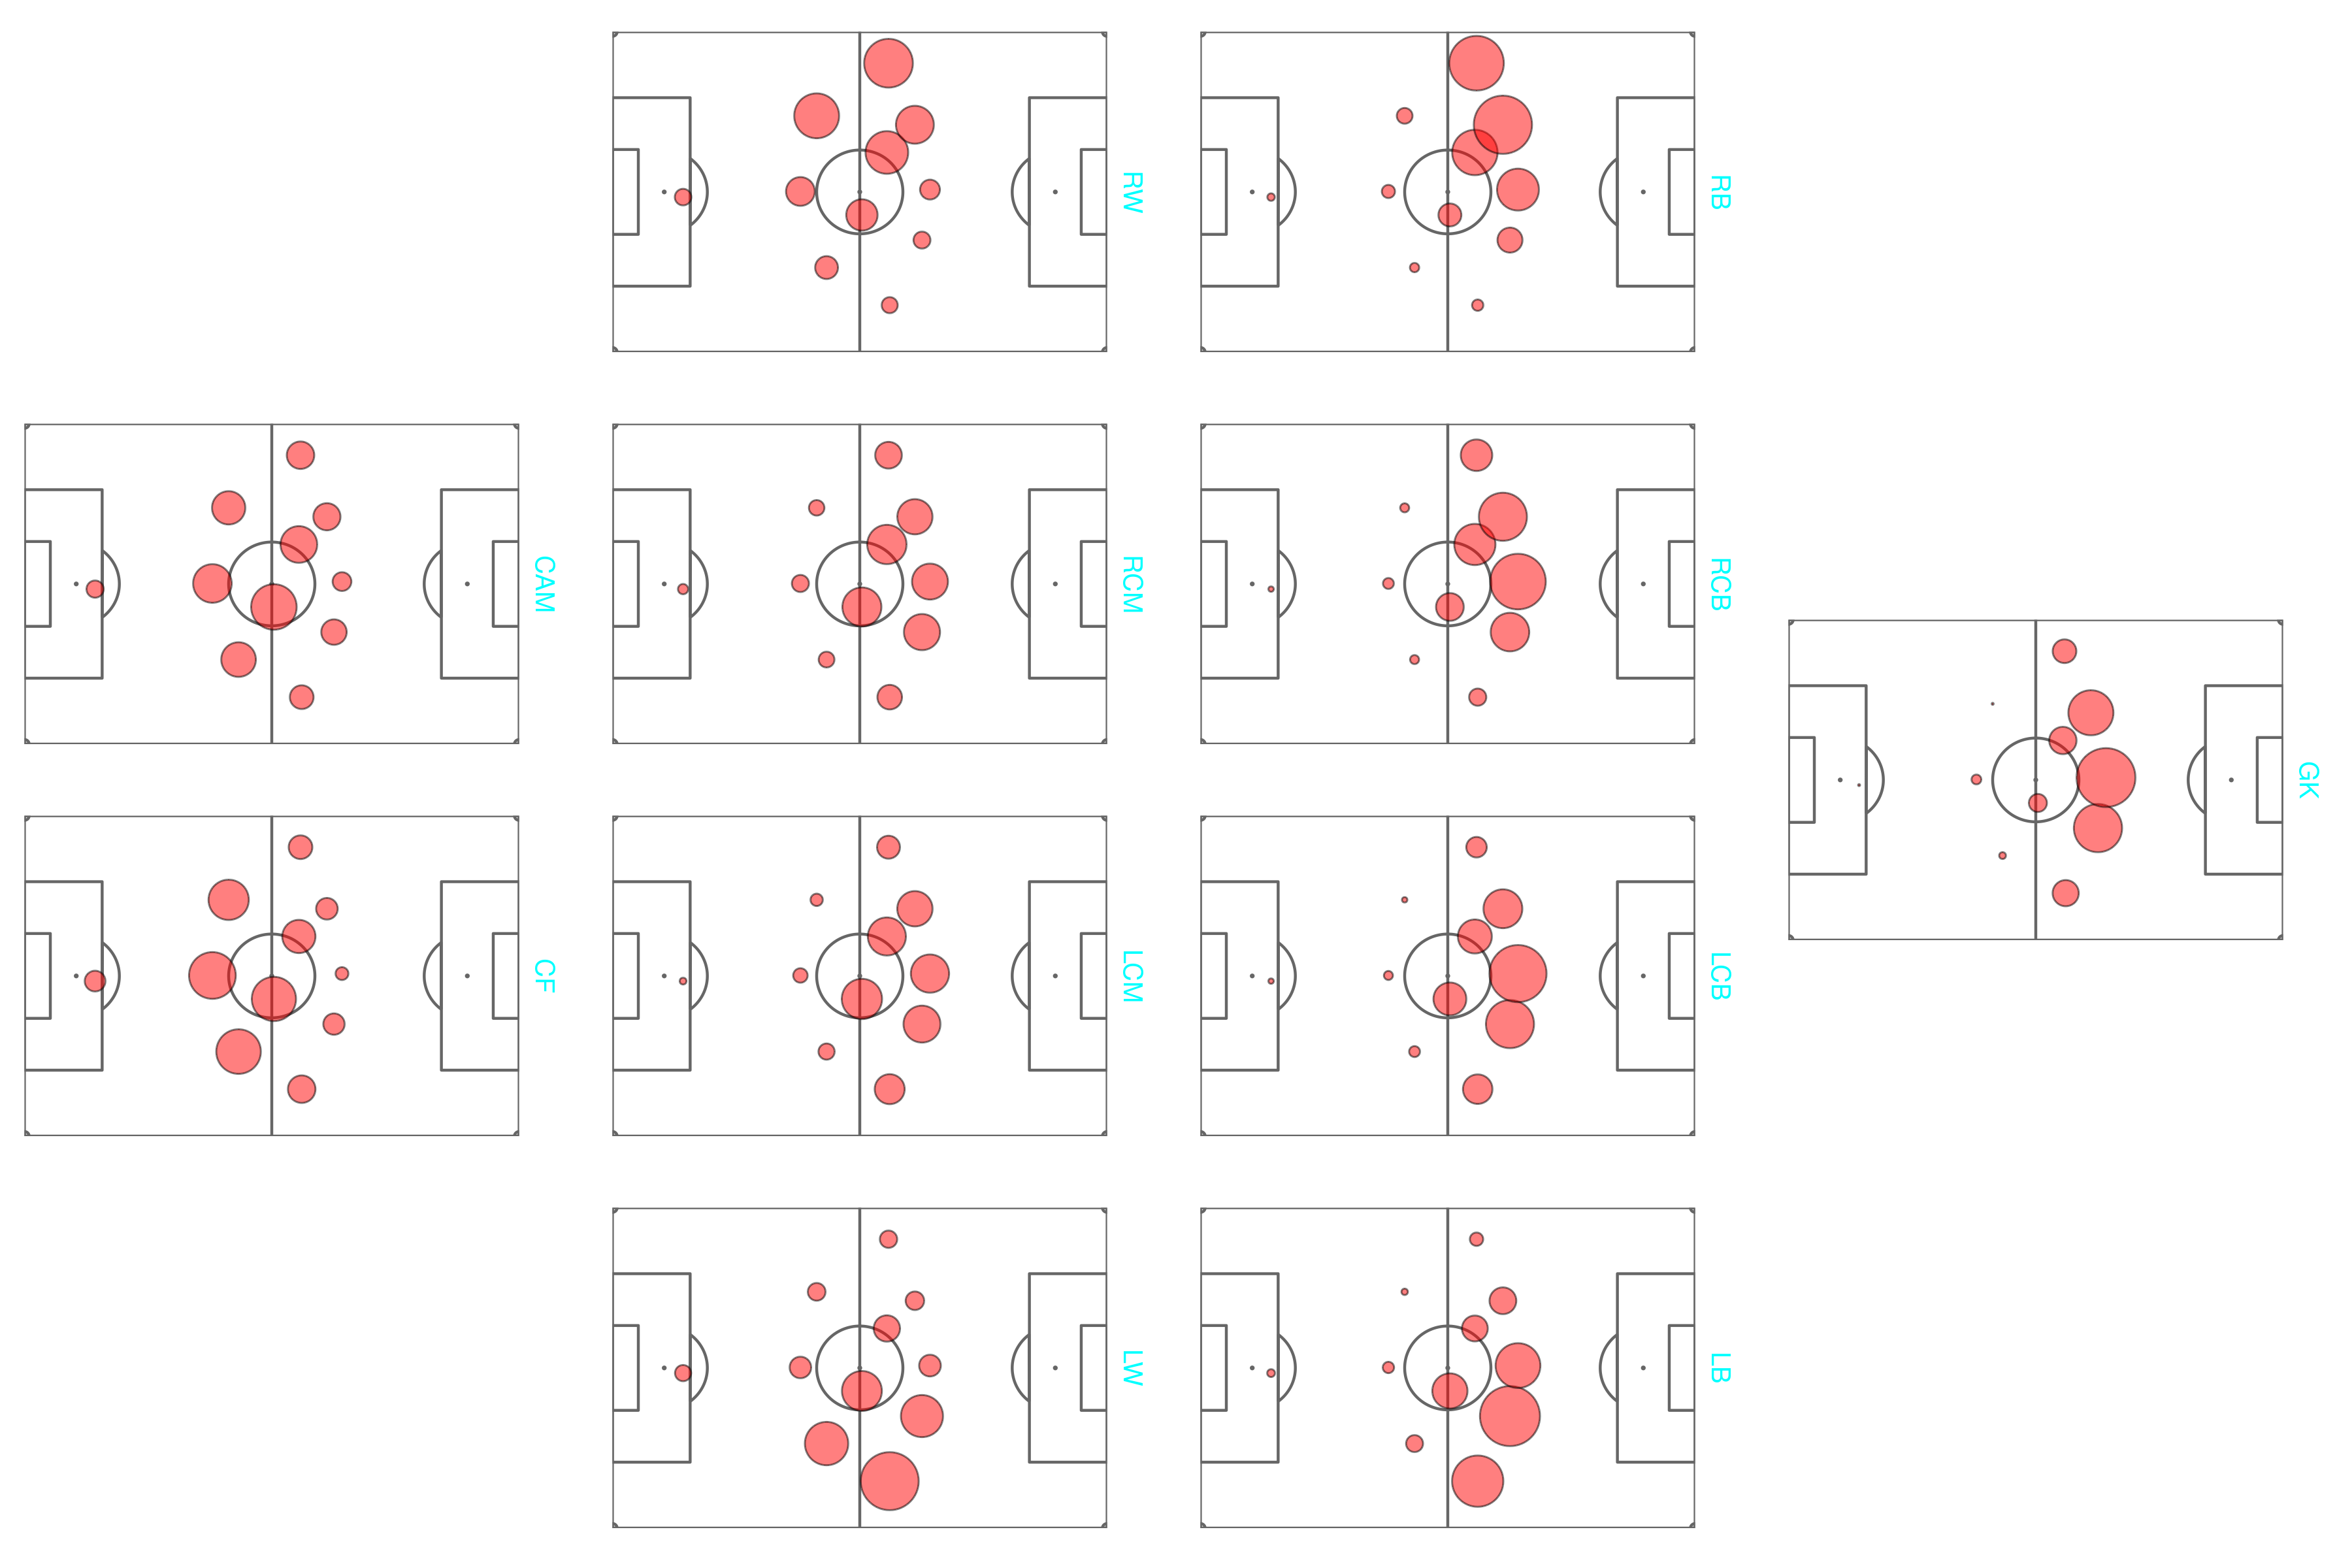
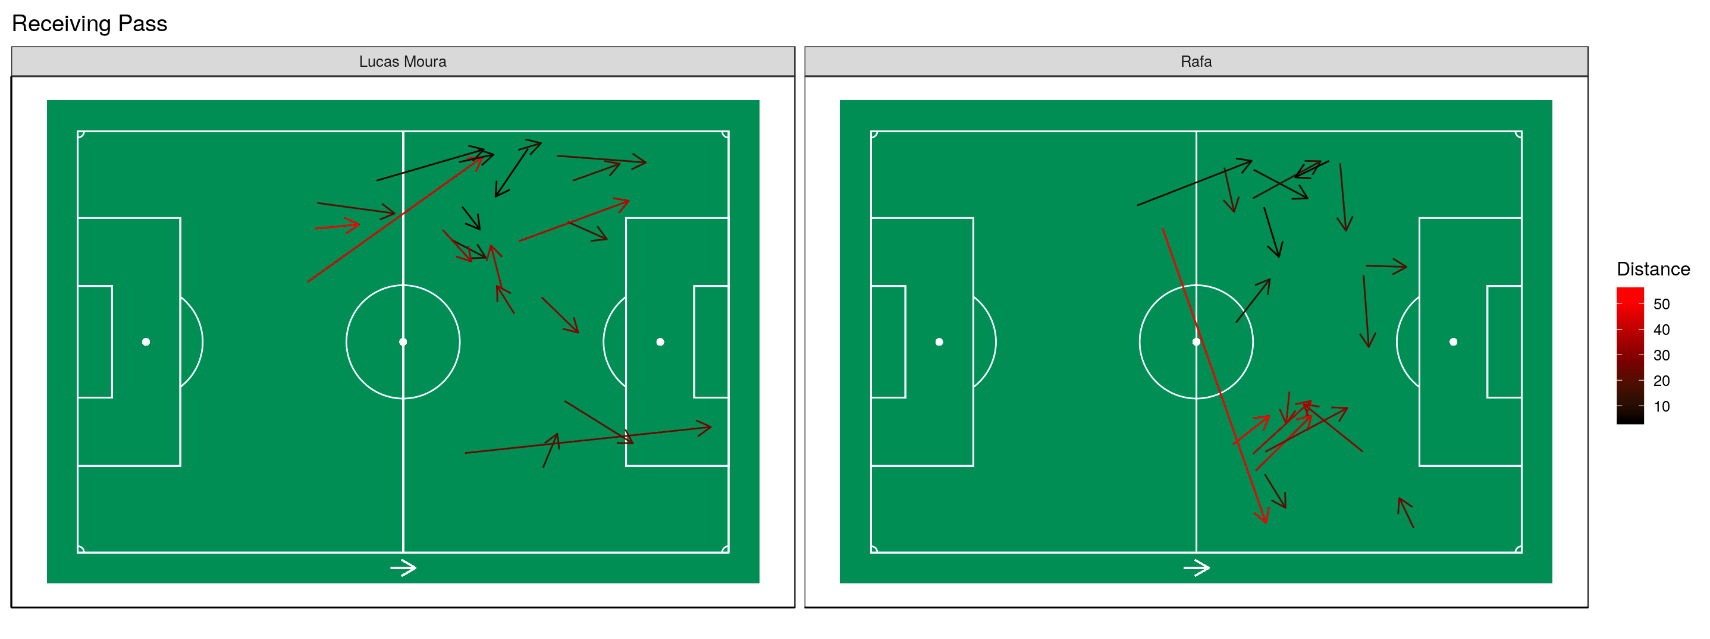
A model to quantify the impact of a player on preventing goals, passes, and carries from happening.
And using them in various ways
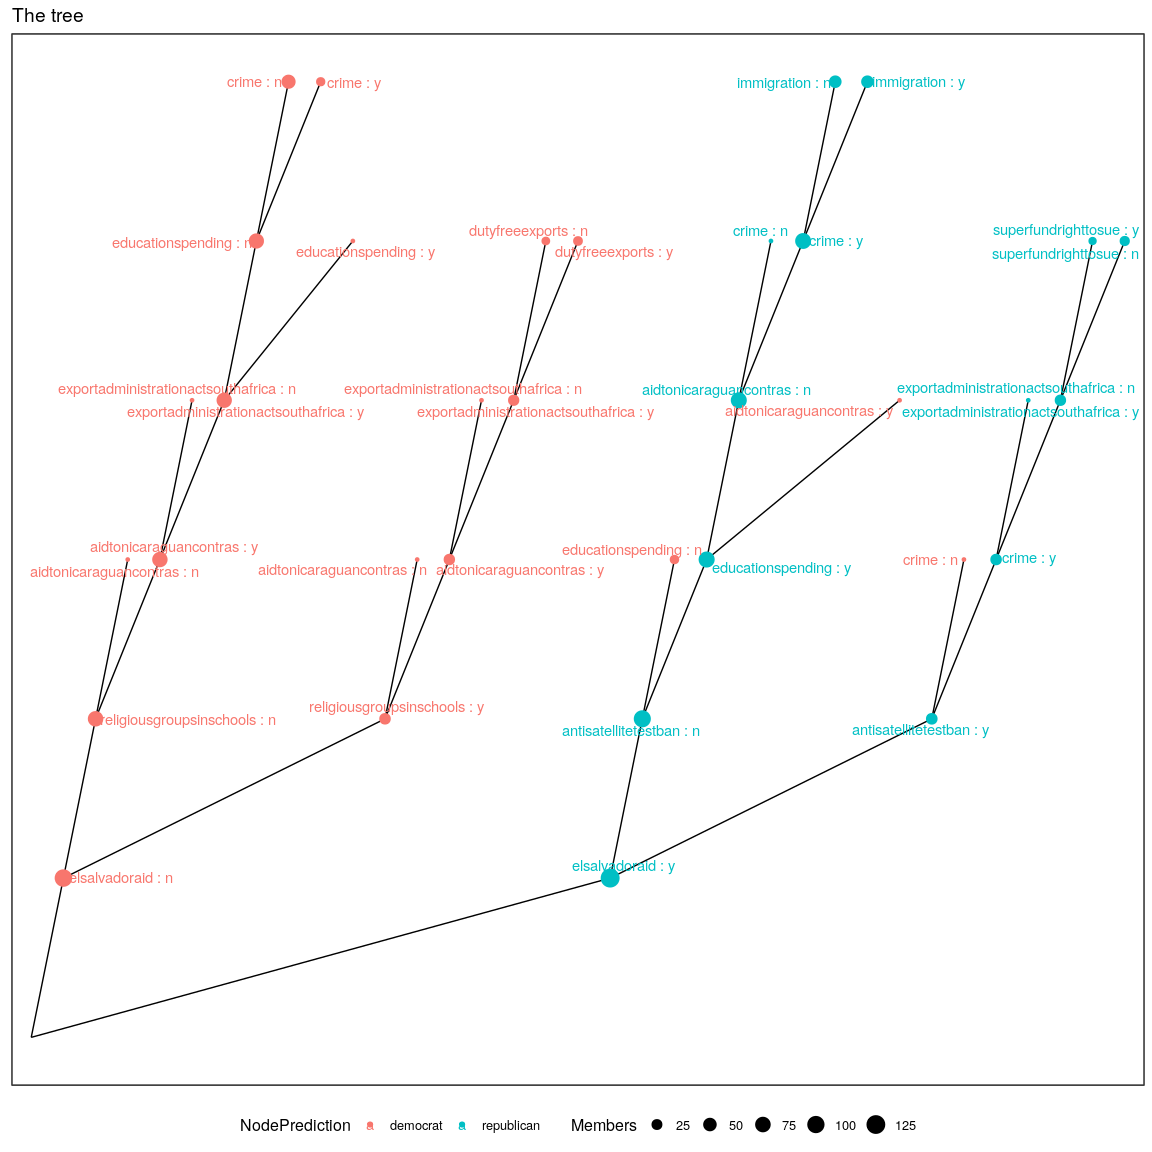
Clustering categorical datasets
An R-Shiny based tool for solving the warehouse problem
Category Others
Clustering categorical datasets
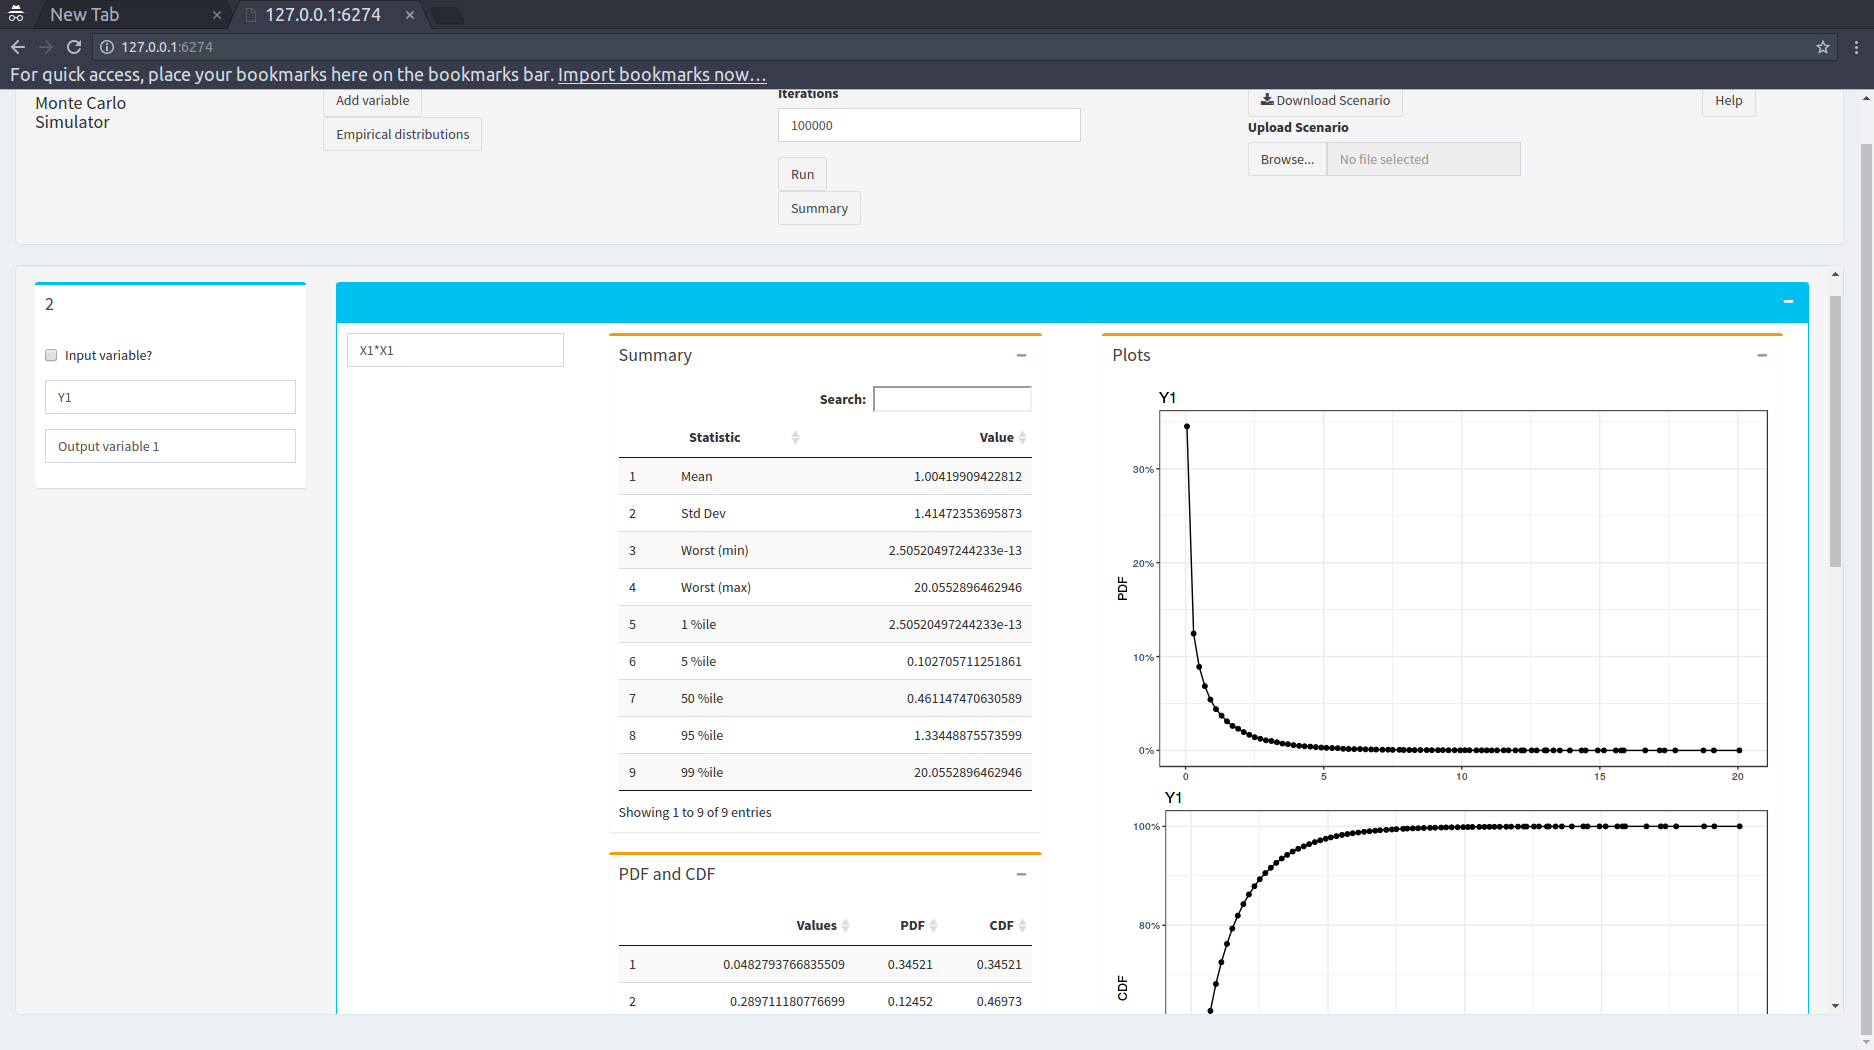
An R-Shiny based tool for running Monte Carlo simulations
Trying to predict successful transfers using VAEP
Most models seem to be outcome based. What changes if try to incorporate intent?
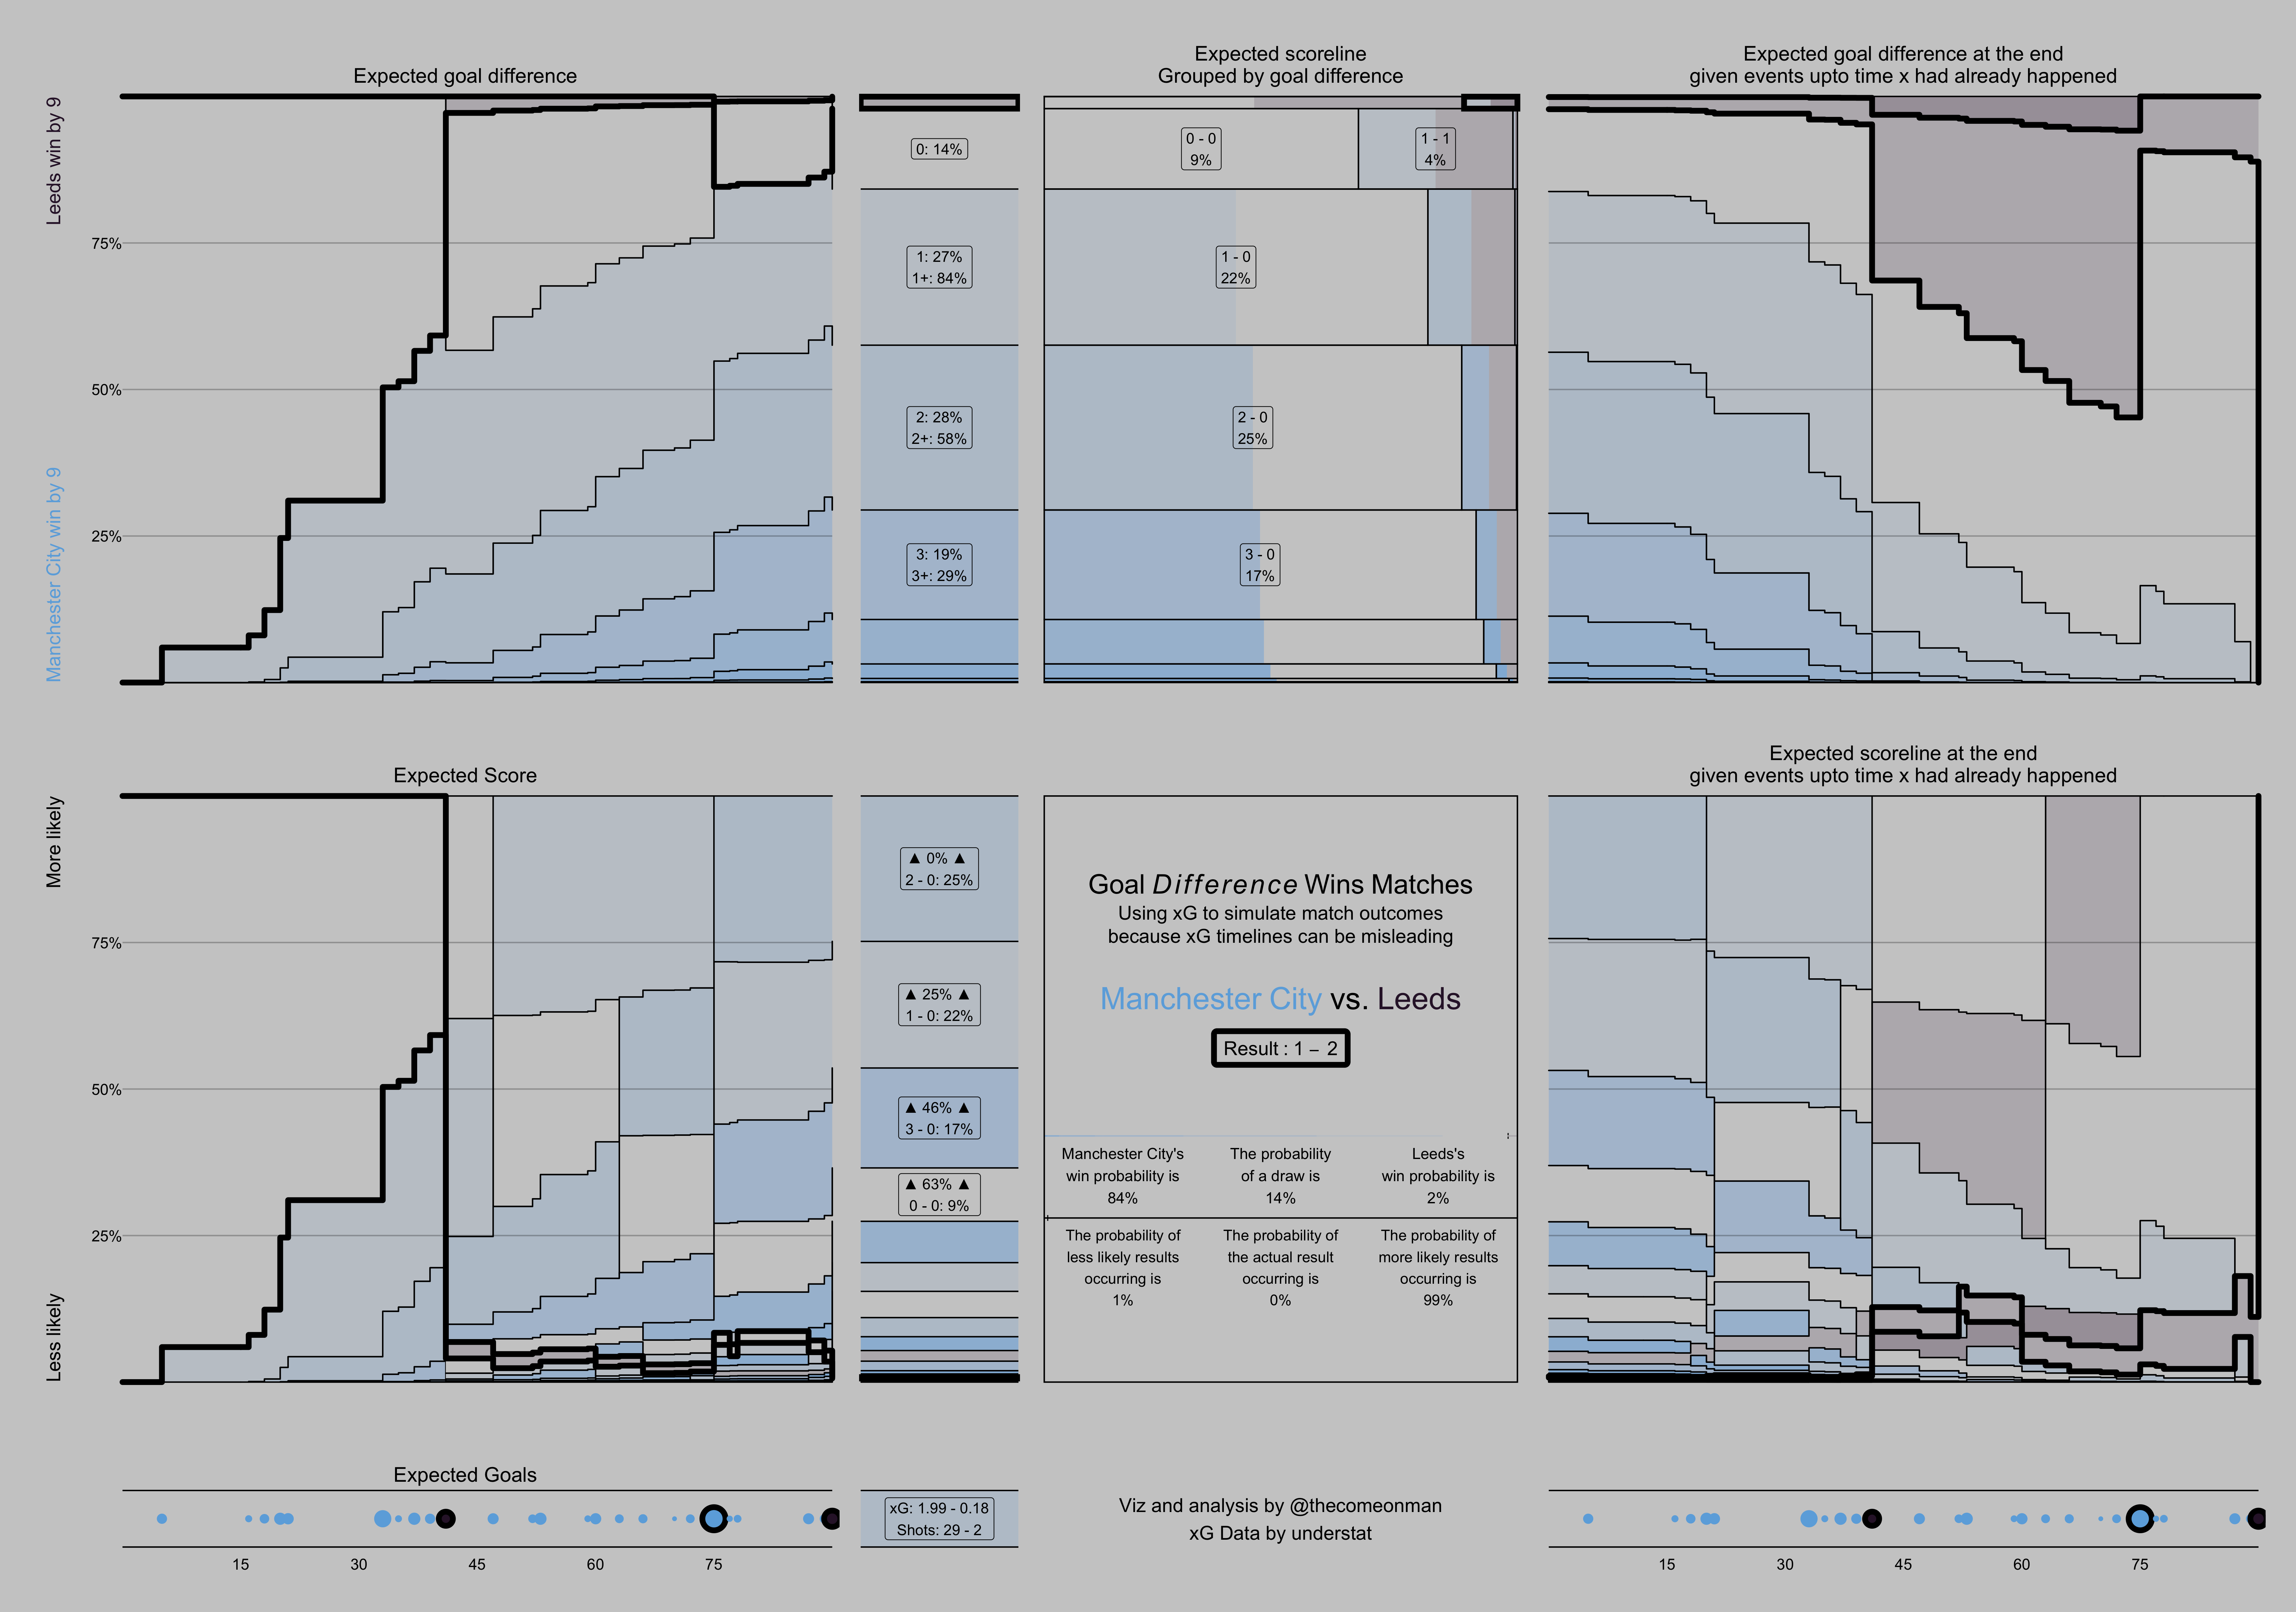
Understanding how to use xG instead of just summing it up
An R library for football analytics which offers visualisations, simple models, and other things
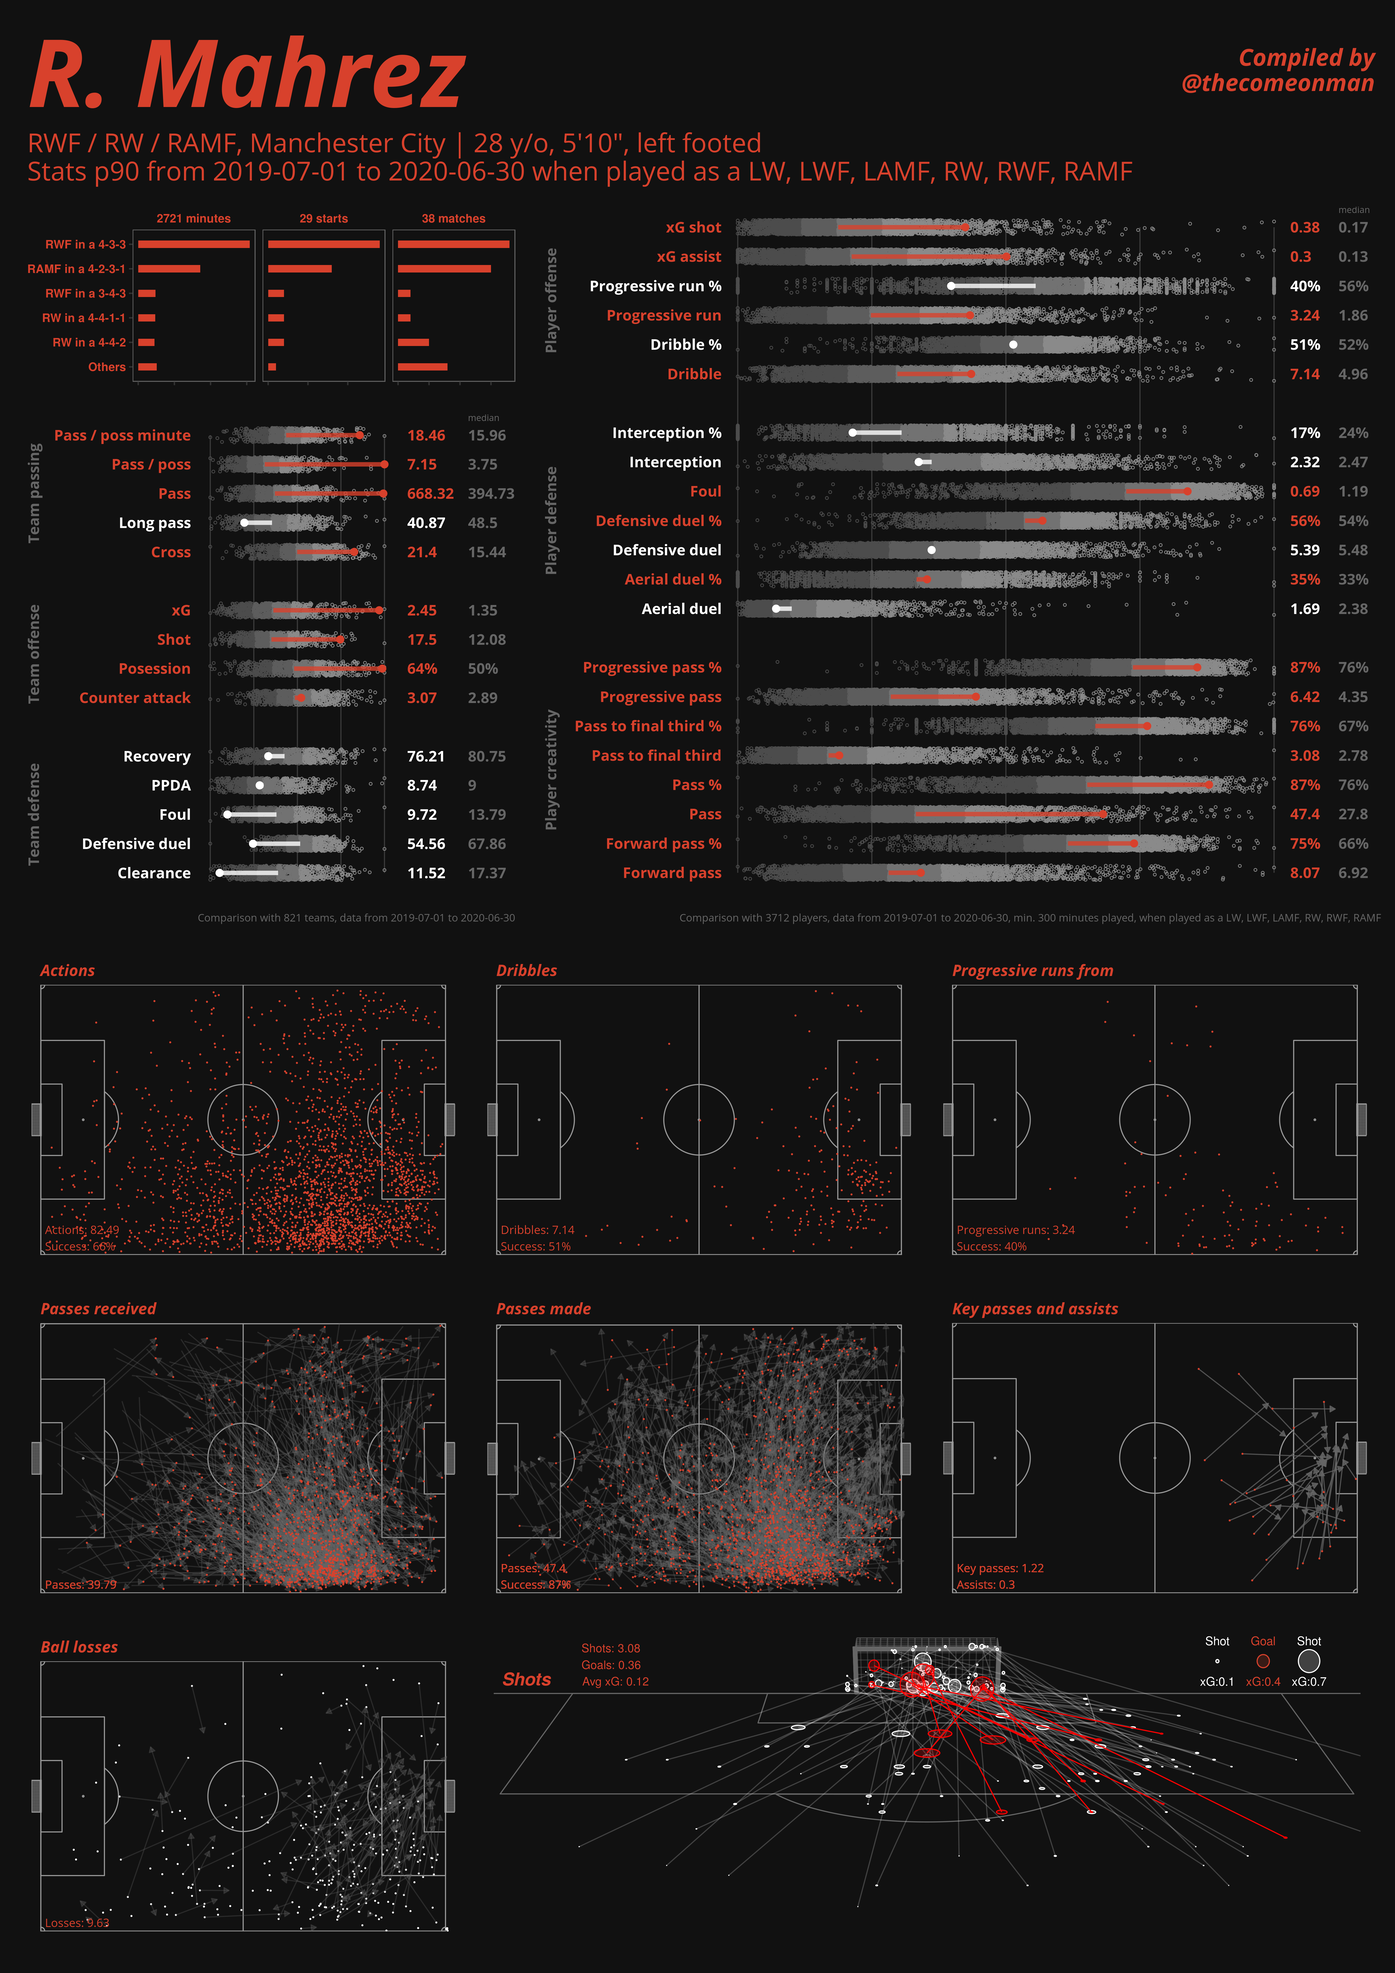
Data dense scouting report of players
A model to quantify the impact of a player's actions beyond just goals and assists.
Finding similar players using match level aggregated data, such as passes attempted during the game
A model to quantify the impact of a player on preventing goals, passes, and carries from happening.
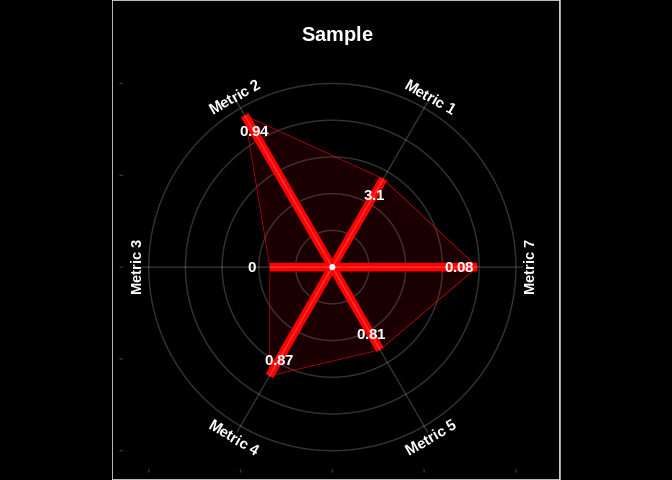
A more informative, better visualisation
And using them in various ways
Category Visualisation
Understanding how to use xG instead of just summing it up
An R library with some high and low level functions for 3D geometry in a ggplot2 compatible fashion
Data dense scouting report of players
A more informative, better visualisation
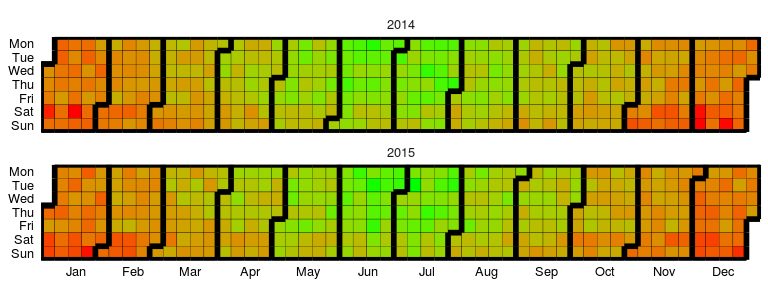
A ggplot library for time series visualisation in R